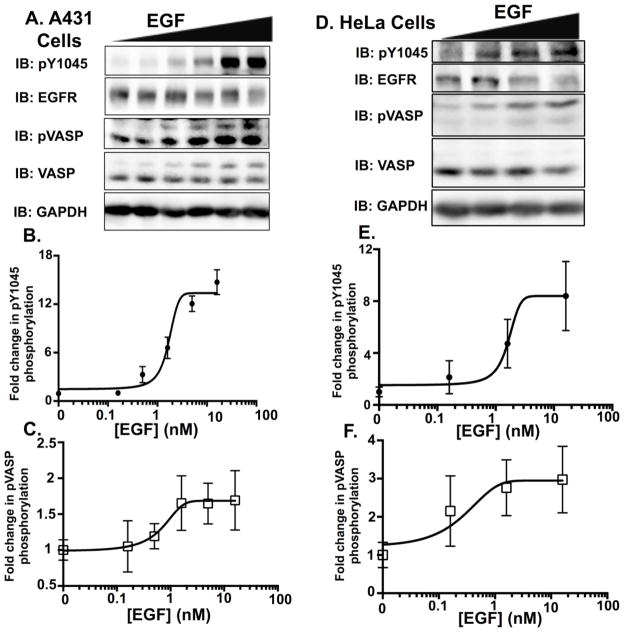
Figure 2. Increases in EGF ligand concentration elicit a dose dependent increase in pVASPSer239 phosphorylation in A431 and HeLa cell lines.
A. A dose response was conducted in A431 cells using 0, 0.16, 0.5, 1.6, 5 and 16 nM concentrations of EGF ligand. Cells were serum starved for 2 hours, and then exposed to the various ligand concentrations for 60 minutes. Forty μg of protein per sample were then resolved on a 10% SDS-PAGE. Western blot data of pY1045 (B.) and pVASPSer239 (C.) from three independent dose response experiments in A431 cells were quantified to blots of total protein (EGFR and VASP, respectively) using ImageJ software. Error bars are expressed as ± SEM. D. A dose response was conducted in HeLa cells using 0, 0.16, 1.6 and 16 nM concentrations of EGF ligand. Cells were serum starved for 2 hours, and then exposed to the various ligand concentrations for 60 minutes. HeLa cell lysates (60 μg) were then resolved on a 10% SDS-PAGE. Western blot data of pY1045 (E.) and pVASPSer239 (F.) from three independent dose response experiments in HeLa cells were quantified to blots of total protein (EGFR and VASP, respectively) using ImageJ software. Error bars are expressed as ± SEM (n=3).

