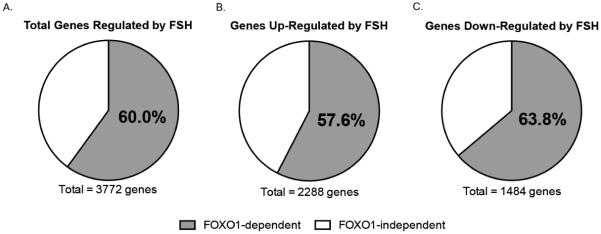
Figure 1. Summary of FSH genes regulated by FOXO1.
Panels are pie charts showing the percentage of all FSH target genes activated and repressed by FOXO1 (Panel A); the percentage of genes up-regulated by FSH that are repressed by FOXO1 (Panel B); and the percentage of genes down-regulated by FSH that are activated by FOXO1 (Panel C).

