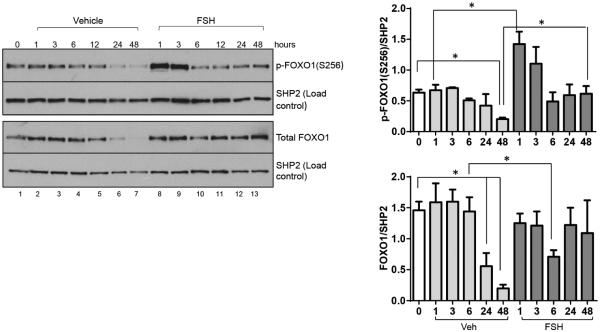
Figure 5. Time course of the phosphorylation of FOXO1 on Ser256 in GCs treated with vehicle or FSH.
GCs were plated and treated the following morning with vehicle or FSH for indicated times. Time “0” reflects cells that were not treated and was taken at the time of cell treatments. Total cell extracts were collected as described in Materials and Methods, proteins were separated by SDS-PAGE, and western blots probed with indicated antibodies (FOXO1 phosphorylated on Ser256, p-FOXO1(S256); SRC homology-2 (SH2) domain-containing tyrosine phosphatase, SHP2). Representative western blots are shown in the left panel. Results in right panels are means ± SEM of 3 independent experiments. Statistical significance was determined by unpaired Student’s t test. Comparisons for vehicle-treated cells were made relative to time 0. An asterisk indicates a statistically significant difference (P<0.05) between each vehicle treatment time and time 0 value. Comparisons for FSH-treated samples at each time point were made relative to the comparable vehicle-treated sample. An asterisk indicates a statistically significant difference (P<0.05) between vehicle- and FSH-treatment at each time point.

