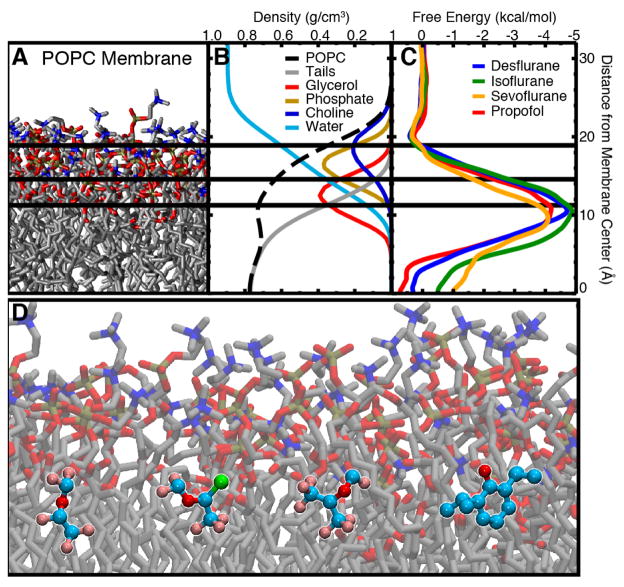
Figure 4.
Partitioning profiles of inhaled anesthetics into a POPC membrane. A) Snapshot of the POPC membrane used in the simulations. Water and ions are omitted for clarity. The color of the atom groups in this image corresponds to the color of the curves in the density profiles. B) Density profile of the simulated systems used to demarcate the regions of the membrane for analysis of anesthetic–membrane interactions. Here, total POPC density is shown as the black dashed line and water density is shown as the light blue line. POPC density was further subdivided into tail (gray), glycerol (red), phosphate (gold), and choline (blue) density. The colors of the curves correspond to the color of the atoms shown in (a). C) PMF for inserting desflurane (blue), isoflurane (green), sevoflurane (orange), and propofol (red) into the membrane. All anesthetics show a distinct energy minimum at the interfacial region, while there is negligible energy difference between the bulk aqueous environment and midpoint of the lipid bilayer. D) Representative snapshot of (starting on left and moving right) desflurane, isoflurane, sevoflurane, and propofol in the umbrella sampling simulations showing the low energy conformation at the amphipathic boundary of the membrane. Figure reprinted from Arcario et al. [89].

