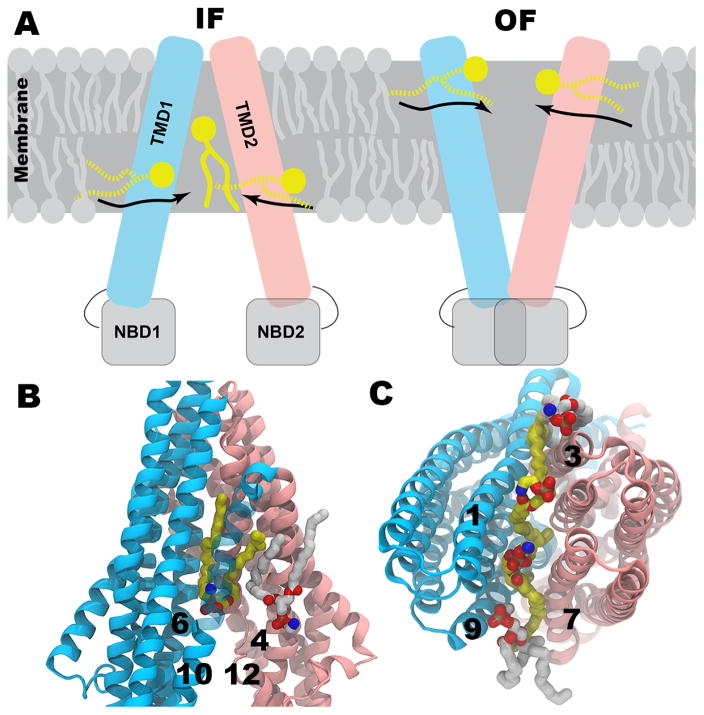
Figure 8.
Lipid binding to Pgp in its IF and OF states. a) Schematic representation of IF and OF conformations of Pgp. Half-inserted and fully inserted lipid molecules are shown in broken and solid yellow lines, respectively. b) Lipid binding through both probable drug entry portals (TM4&6 and TM10&12) in IF conformation. c) Lipid binding through both probable drug entry portals (TM1&3 and TM7&9) in OF conformation. TM helices are in cartoon representation while the initial and final conformations of lipid molecules are in white and yellow sticks, respectively. Hydrogen atoms are not shown for clarity.

