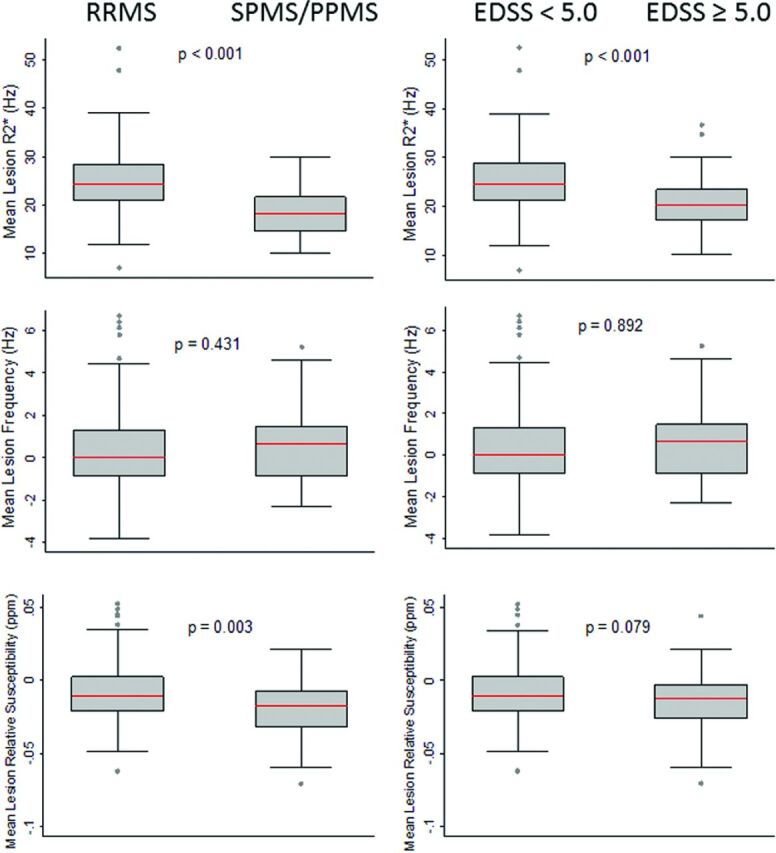
Fig 3.

Quantitative comparison of lesion susceptibility values by disease subtype and level of disability. Box-and-whisker plots showing a quantitative comparison of mean lesion R2*, frequency (from phase), and relative susceptibility (from QSM) between subjects with RRMS and SPMS/PPMS (left column) and those with lower-versus-higher levels of disability based on the EDSS score (right column). Lesion R2* values were significantly lower in SPMS/PPMS and EDSS ≥ 5.0, and mean lesion relative susceptibility was lower in SPMS/PPMS. Lesion values were taken as the mean of all voxels within each lesion. Red lines indicate the median value for all lesions in each group. P values represent the results of Wilcoxon rank sum testing.
