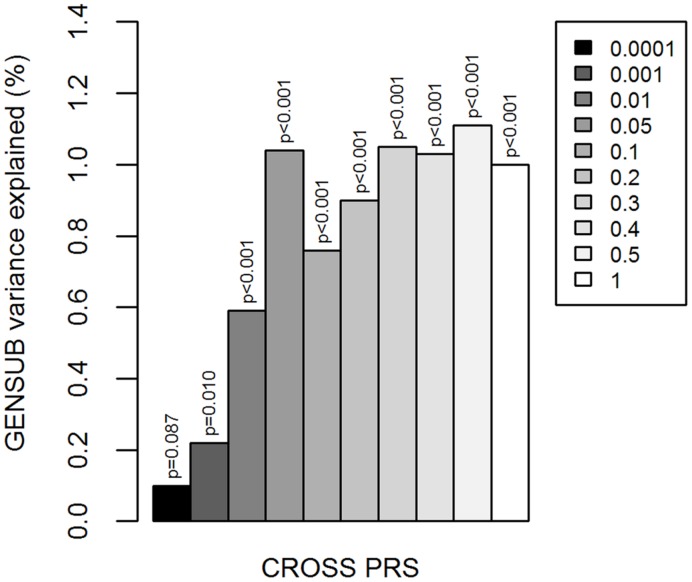
FIGURE 1.
Cross-disorder polygenic risk scores and general substance involvement liability. Y-axis is the percent of variation in GENSUB explained by CROSS PRS. Shades of gray in legend indicate the p-value threshold (i.e., p < 0.0001, 0.001, 0.01, 0.05, 0.1, 0.2, 0.3, 0.4, 0.5, or 1.0) at which the risk score was calculated based on the results of the original cross-disorder meta-analysis. CROSS, cross-psychiatric-disorder. GENSUB, general substance involvement liability. PRS, polygenic risk score.

