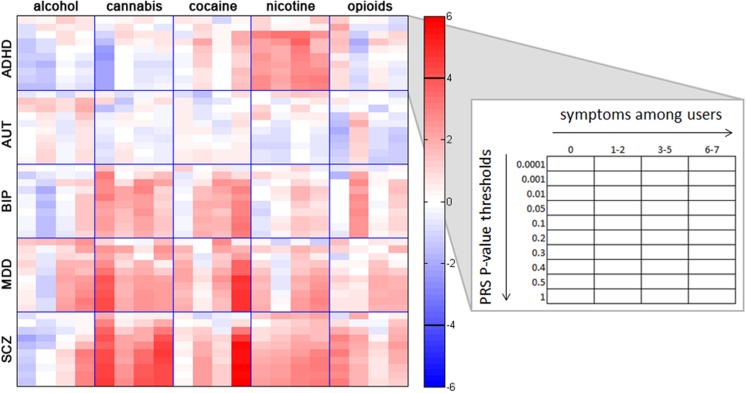
FIGURE 2.
Associations between individual substance involvement and polygenic risk scores (PRS) for five major psychiatric disorders. Within each grid space, p-thresholds at which PRS were calculated (i.e., p < 0.0001, 0.001, 0.01, 0.05, 0.1, 0.2, 0.3, 0.4, 0.5, and 1.0) are represented vertically in ascending order. Levels of involvement (i.e., no/non-regular use, use without endorsement of any dependence symptoms, 1–2 dependence symptoms, 3–5 dependence symptoms, and 6–7 dependence symptoms) are represented horizontally in ascending order. Colors represent z-scores for each association test, with no lifetime or nonregular use as the reference group. For example, the red colors in the crosstab between SCZ and cannabis indicate a high correlation between genetic risk for SCZ and cannabis involvement. The black horizontal bars in the color bar indicate the approximate z-score cutoff for significance post-correction for multiple comparisons (z = ± 3.911). Post-hoc Wald tests comparing all levels of substance involvement with one another are reported in Supplementary Tables S2–S7. ADHD, attention deficit hyperactivity disorder; AUT, autism; BIP, bipolar disorder; MDD, major depressive disorder; SCZ, schizophrenia.

