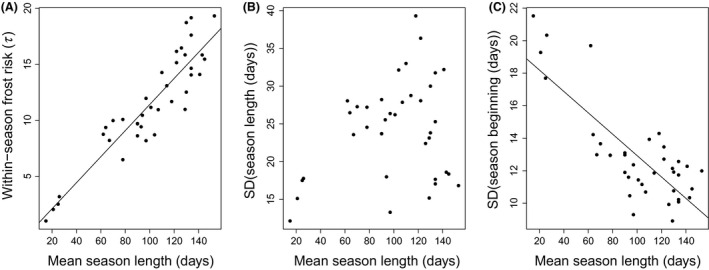
Figure 1.

Parameter τ that describes within‐season frost risk (A), standard deviation in the length of the favorable season (referred to as season; (B) and standard deviation of season beginning date (C) per location shown according to mean season length. Increasing values of τ mean decreasing frost risk. Mean season lengths (mean daily temperature >10°C), values of τ and standard deviations of season length and beginning date were estimated from data on daily mean temperatures during 1961–2012 from 38 arbitrary locations in Sweden (see text for details; Fig. S1). The regression equation in (A) is τ = 0.116 × (mean season length) − 0.223 (regression model F 1,36 = 187, P < 0.0001) and in (C) SD(season beginning) = 19.5 − 0.066 × (mean season length) (regression model F 1,36 = 62.3, P < 0.0001).
