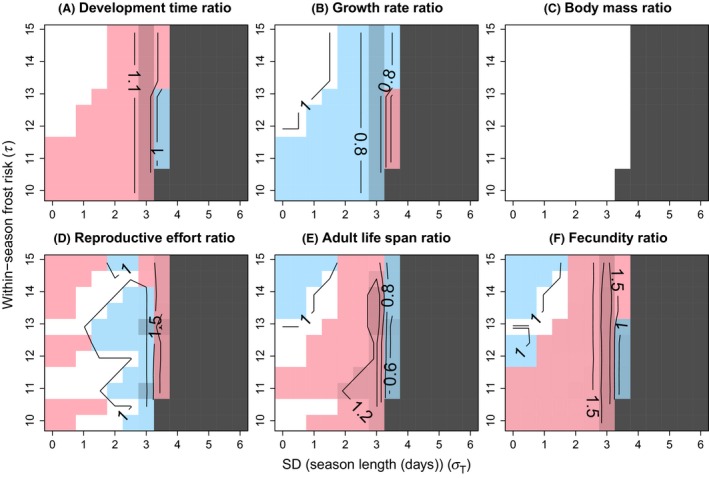
Figure 4.

Contour diagrams of relative life history differences between the direct development and the diapause pathway with egg diapause. Trait value in the direct development pathway is divided by the trait value in the diapause pathway. The ratio is shown for larval development time (A), larval growth rate (B), pupal mass (C), reproductive effort (D), adult life span (E), and lifetime fecundity (F) in relation to standard deviation of season length (σ T) and within‐season risk of frosts (τ; risk increases with decreasing value of τ). See Figure 3 for explanation of the colors and the coarse pattern of variation. Parameter values were as follows: c 1 = 2.5, c 2 = 2, a = 50, b = 0.01, c d = 0.05, k = 2, z = 0.001, B = 3, m min = 80, t pupa = 1, d = 0.15, M juv0 = 0.01, M ad = 0.15, r = 0, μ T = 36, μ I = 162, and σ I = 4.16.
