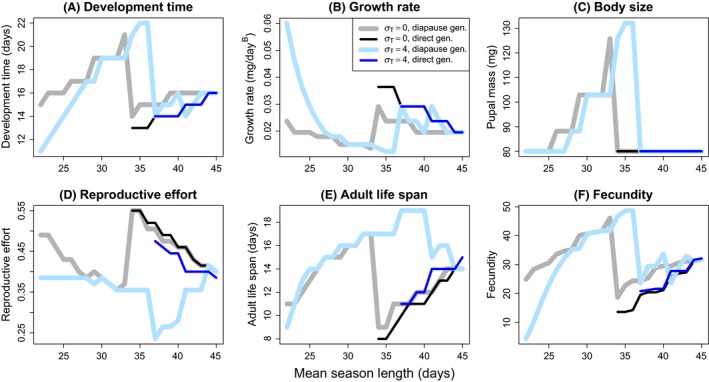
Figure 5.

Clinal variation in larval development time (duration of growth; A), growth rate (B), pupal mass (C), reproductive effort (D), adult life span (E), and lifetime fecundity (F) in the diapause (thick lines) and direct development (thin lines) pathways in relation to mean length of the favorable season (μ T) with pupal diapause. The predictions are presented for two standard deviations of season length: σ T = 0 (gray and black lines) and σ T = 4 days (light blue and dark blue lines). Note that direct development is only expressed (i.e., phenology is bivoltine) when mean season length is relatively long. Parameter values were as follows: c 1 = 2.5, c 2 = 2, a = 50, b = 0.01, c d = 0.05, k = 2, z = 0.001, B = 3, m min = 80, t pupa = 1, d = 0.15, M juv0 = 0.01, M ad = 0.15, τ = 0.35 × μ T − 0.19, μ I = 180 − μ T/2, σ I = 6.5–0.065 × μ T, and r = 1.
