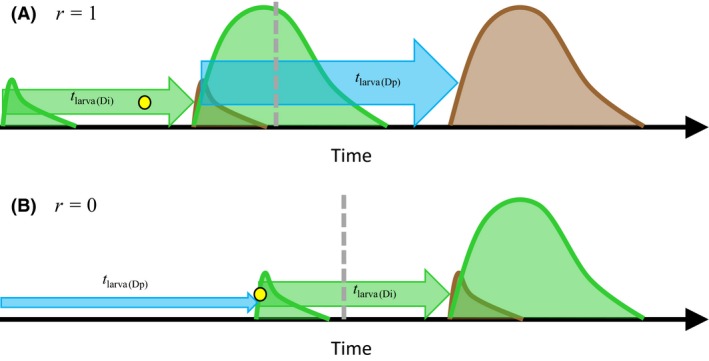
Figure 7.

A schematic illustration of the timing of life history events with pupal (A) and egg (B) diapause under bivoltine phenology. The green distributions illustrate reproduction (number of eggs) in the two generations emerging within the season. The brown distributions illustrate pupation (number of pupae) in the offspring generations. The heights of the distributions are not exactly in a scale but illustrate the size difference between the generations. Larval development is depicted with green (direct development generation; duration t larva(Di)) and blue (diapause generation; duration t larva(Dp)) arrows, the heights of the arrows indicating the sizes of the generations (not in scale, but illustrate the rank order between generations). The yellow dots indicate the sensitive developmental stage for diapause induction, and the vertical gray dashed line the time when the critical photoperiod of diapause induction occurs. A single female was assumed in the beginning of the season. For the purpose of illustration, pupal development time was assumed to be zero. Note that reproduction extends over a longer time period in the second generation than in the first one because adult emergence is asynchronous in the second generation but synchronous in the first one.
