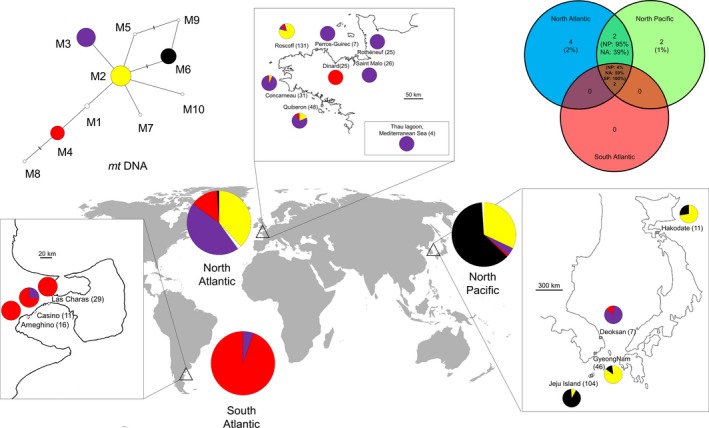
Figure 3.

Diversity of Polysiphonia morrowii and the distribution of mitotypes collected in the North Atlantic (n = 297), the South Atlantic (n = 56) and the North Pacific (n = 168). Different colors represent distinct mitotypes. Private mitotypes are shown in white. Left, median‐joining network analysis of relationships among of the cox1 sequence in 521 individuals of P. morrowii. Circle surface area is proportional to mitotype frequency. Lines drawn between mitotypes represent single mutational steps, and small bars represent additional mutational steps. In the top right, Venn diagram representing mitotypes shared within the three different areas.
