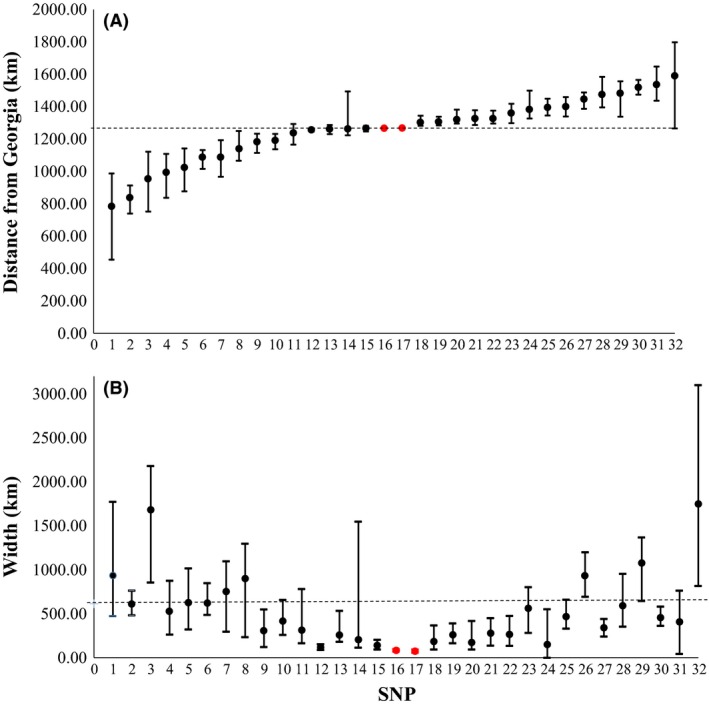
Figure 3.

Cline centers (A) and widths (B). Mitochondrial loci highlighted in red. Loci are arranged in the order of increasing distance of the cline center from Georgia. Numbering on the x‐axis corresponds to SNP locus numbers as designated in Table 2. Error bars represent the 2‐unit support limits of the estimates. (A) Dashed line illustrates center of mitochondrial clines. (B) Dashed line represents width of neutral cline calculated from mark–recapture estimate of dispersal. Clines with an upper 2‐unit support limit below the dashed line are putatively non‐neutral.
