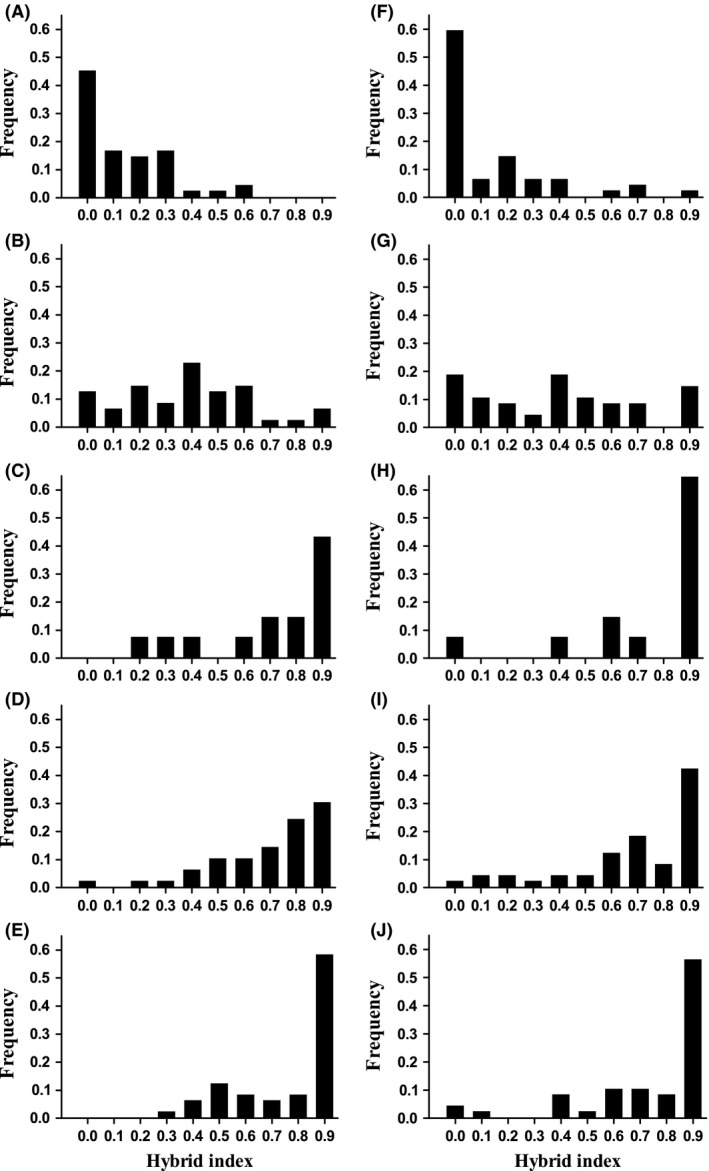
Figure 5.

Histogram of hybrid index values of individuals collected from hybrid zone populations calculated using introgress, with individuals collected from Cheesequake and RUMFS designated as northern and southern parental types, respectively. Hybrid index values were calculated using (A–E) all 30 nuclear SNPs and also calculated using (F–J) a subset of five SNPs. A hybrid index value of 0 indicates a pure southern individual; a hybrid index value of 1 indicates a pure northern individual. Populations are arranged from south to north. Panels A&F, location 11; Panels B&G, location 10; Panels C&H, location 9; Panels D&I, location 7; Panels E&J, location 6. Note that hybrid index was not calculated for location 8 because of a limited sample size.
