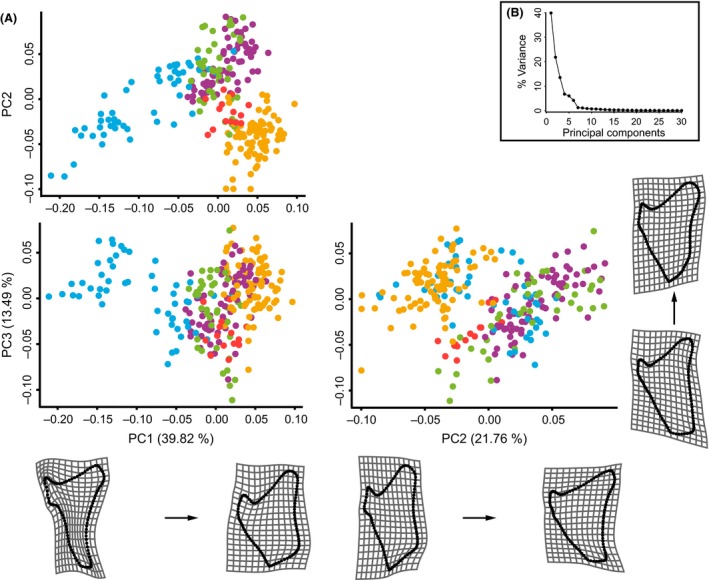
Figure 3.

Patterns of ariid opercle shape variation along major axes of variance. (A) Scatterplots of the first three principal components (PCs) of ariid opercle shapes (N = 263) from 21 species belonging to the genera Bagre ( ), Sciades (
 ), Cathorops (
 ), Notarius (
 ), and Ariopsis (
 ). A detailed scatterplot of species can be found in Figure S1. The opercle shape changes are displayed below or next to the respective axes of variance using thin plate spline visualization grids using the starting shape at scale factor 0 as reference shape. The respective shape changes are scaled by −0.2 and +0.1 (magnitude of shape change in Procrustes distance) for PC1, −0.1 and +0.1 for PC2, and −0.1 and +0.07 for PC3. (B) Scree plot of the first 30 PCs and their amount of variance. The bent after the third PC indicates a distinct drop in the impact of following PCs on shape variance. Therefore, only the first three PCs are presented in the scatterplot. The first three PCs together account for 75.07% of the observed variation.
