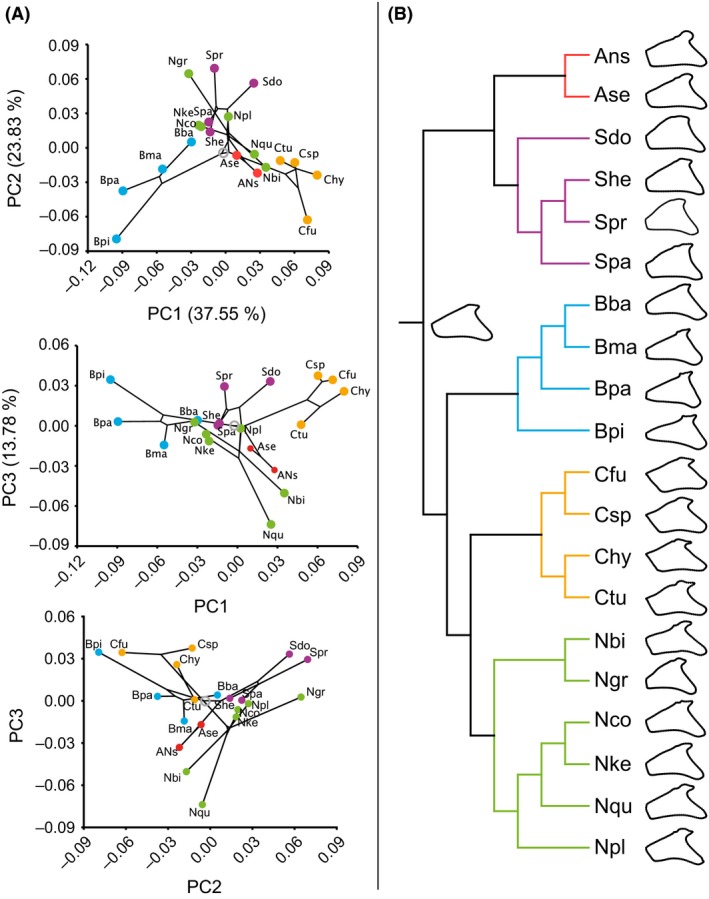
Figure 4.

Evolutionary opercle shape change within Ariidae. (A) Phylomorphospace plot of ariid opercle shape changes. A time‐calibrated tree constructed from mitochondrial and nuclear markers published by Betancur‐R et al. (2012) has been projected on PC scores derived from species means. The first three principal components account for 75.16% of the total variation. PC scores of 20 species are displayed and highlighted by genus (Bagre ( ), Sciades (
 ), Cathorops (
 ), Notarius (
 ), and Ariopsis (
 ), root (
 )). Ans: A. sp. nov. Ase: A. seemanni; Sdo: S. dowii; She: S. herzbergii; Spr: S. proops; Spa: S. parkeri; Bba: B. bagre; Bma: B. marinus; Bpa: B. panamensis; Bpi: B. pinnimaculatus; Cfu: C. fuerthii; Csp: Cathorops sp. (includes C. wayuu and C. nuchalis, as both species do not differ in the 11 genes analyzed by Betancur‐R et al.); Chy: C. hypophthalmus; Ctu: C. tuyra; Nbi: N. biffi; Ngr: N. grandicassis; Nco: N. cookei; Nke: N. kessleri; Nqu: N. quadriscutis; Npl: N. planiceps. PC scores for C. sp. indet. are not displayed, as they are not included in the phylogeny of Betancur‐R et al. (2004). The permutation of shapes along the phylogeny resulted in a P‐value of 0.001 rejecting the null hypothesis of absence of phylogenetic signal. Pagel's λ of 1 is not significantly different from 1 (P = 1) implying opercle shape evolution happened according to the Brownian model of evolution. (B) Evolutionary opercle shape change along the time‐calibrated tree (Betancur‐R et al. 2012) that has been projected on Procrustes coordinates derived from species means. Mean shapes per species are displayed at the node tips, and the ancestral opercle state for the shapes studied here is displayed at the first internal split at the root.
