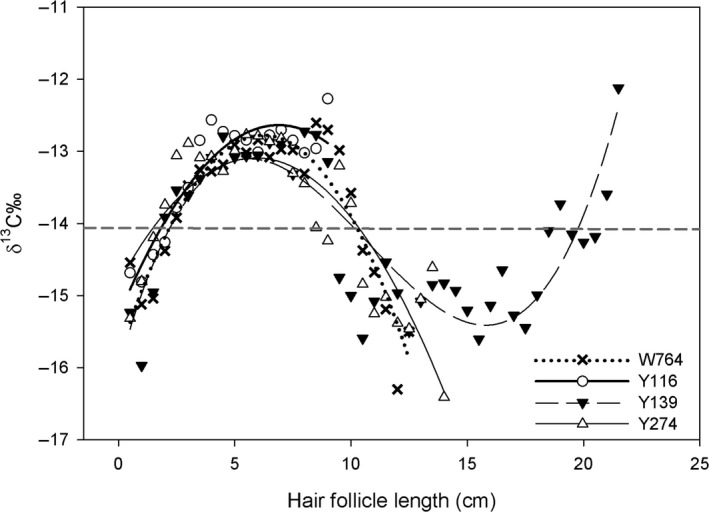
Figure 4.

δ 13C (‰) of yearly composite hair profiles in relation to hair follicle length (cm) for four matriarchal female bison. Values represent averages of δ 13C every 5 mm over a 4‐year period (2010–2013) per individual. Hair follicle length represents the distance from the base of the follicle (collection in late October each year) to older portions of the hair closest to the hair tip. Animal Y139 had hairs of sufficient length (>20 cm) to capture an entire annual diet δ 13C profile. The horizontal dashed line indicates separation of mostly C4 plant diet (above line) and mixed C3–C4 diet (below line).
