Figure 8.

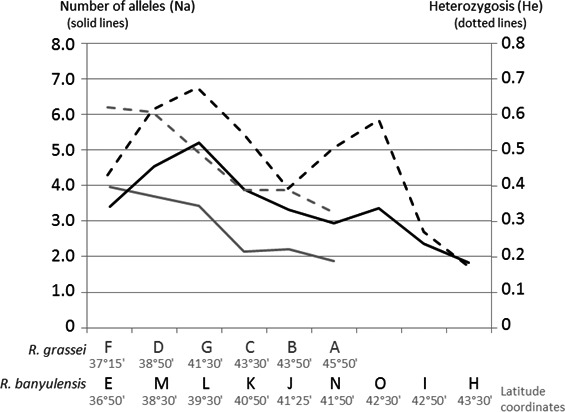
Changes in genetic diversity along a south–north gradient. Allele number (solid lines) and heterozygosity (He, dotted lines) are shown; populations of R. grassei are in gray, and populations of R. banyulensis are in black.

Changes in genetic diversity along a south–north gradient. Allele number (solid lines) and heterozygosity (He, dotted lines) are shown; populations of R. grassei are in gray, and populations of R. banyulensis are in black.