
Figure 3.
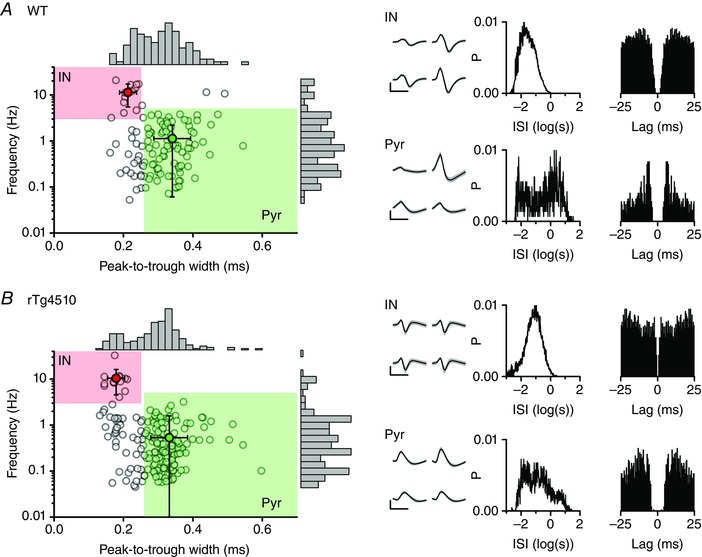
Classification of isolated single units as presumed pyramidal cells and interneuron s
Scatter plots of the peak‐to‐trough widths of spike waveforms vs. basal firing frequency for all 120 and 188 single units isolated from 6 WT (A) and 7 rTg4510 (B) mice, respectively. The shaded areas represent the classification criteria for pyramidal (Pyr) and inter‐neurons (IN). The means (± SD) of the Pyr and IN groups are also plotted. Marginal histograms for each parameter are shown on the opposing axis. An example interneuron and pyramidal neuron from each genotype are depicted on the right: the mean waveforms from each electrode in a tetrode (± SD shown in grey), the inter‐spike interval (ISI) histogram and spike train autocorrelation are shown for each cell.