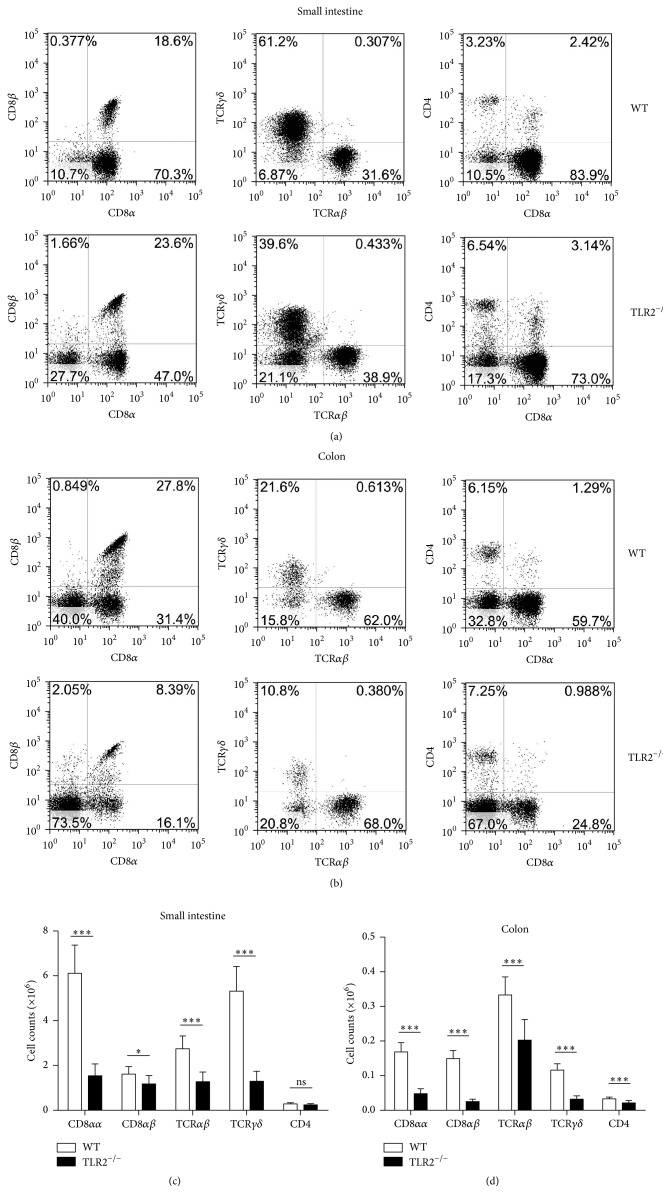
Figure 2.
Changes in the phenotypes of intraepithelial lymphocyte (IEL) in TLR2−/− mice. Cell populations are expressed as the percentage of gated cells with different cell phenotype markers. The data were obtained from CD45-positive cells. (a and b) The IELs from small intestine (a) or colon (b) of mice were stained as indicated. Expression of CD8α and CD8β chains on CD45+ IELs. Cells were stained with anti-CD45, anti-CD8α, and anti-CD8β mAbs and positively gated by CD45. Expression of TCRαβ and TCRγδ on CD45+ IELs. Cells were stained with anti-CD45, anti-TCRαβ, and anti-TCRγδ mAbs and positively gated by CD45. Expression of CD8α and CD4 on CD45+ IELs. Cells were stained with anti-CD45, anti-CD8α, and anti-CD4 mAbs and positively gated by CD45. (c and d) The absolute numbers of the indicated IEL subsets in the small intestine (c) or colon (d) of individual mice. The absolute number of each subset was calculated by multiplying total number of IELs by the percentage of each subset. Five mice per group. Representative of three experiments. ∗ P < 0.05; ∗∗∗ P < 0.001.

