
Fig. 3.
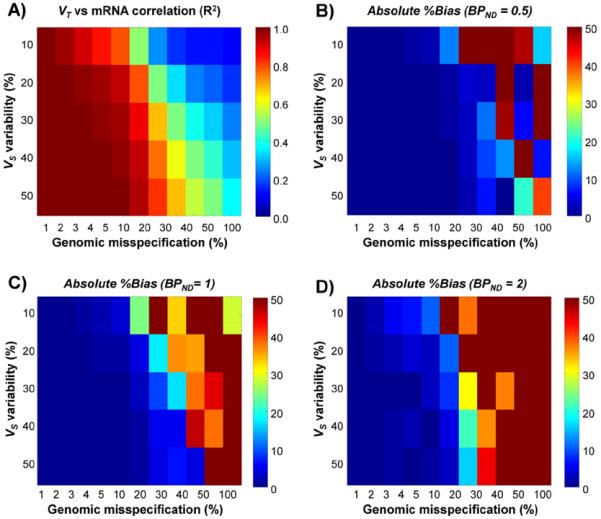
Performance of the genomic plot in simulated data. A) VT vs. mRNA mean correlation (R2) as function of VS variability and genomic misspecification. B-D) Absolute %bias as function of VS variability and genomic misspecification in low-binding scenario (BPND = 0.5), intermediate-binding scenario (BPND = 1) and high-binding scenario (BPND = 2) respectively.