
Figure 2.
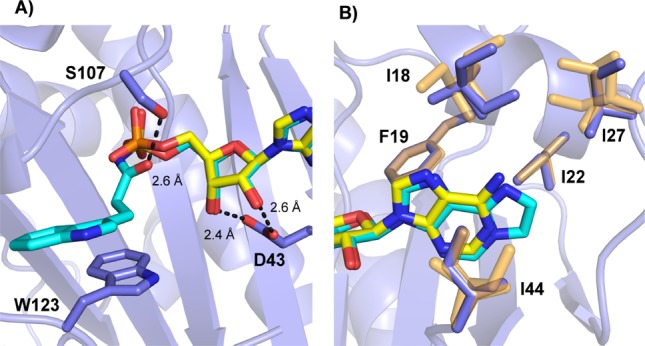
High-resolution X-ray crystal structure analysis of AMP (yellow; pdb: 3TW2) and overlaid with the compound 7 (cyan) in interaction with hHint1 (blue; pdb: 5I2E) complex. (A) H-bond interaction of the sugar and side chain are shown in dotted black lines. (B) Different orientations of isoleucine side chains observed in the hydrophobic nucleotide-binding pocket for AMP and compound 7 bound hHint1 structure is shown in yellow and blue, respectively.