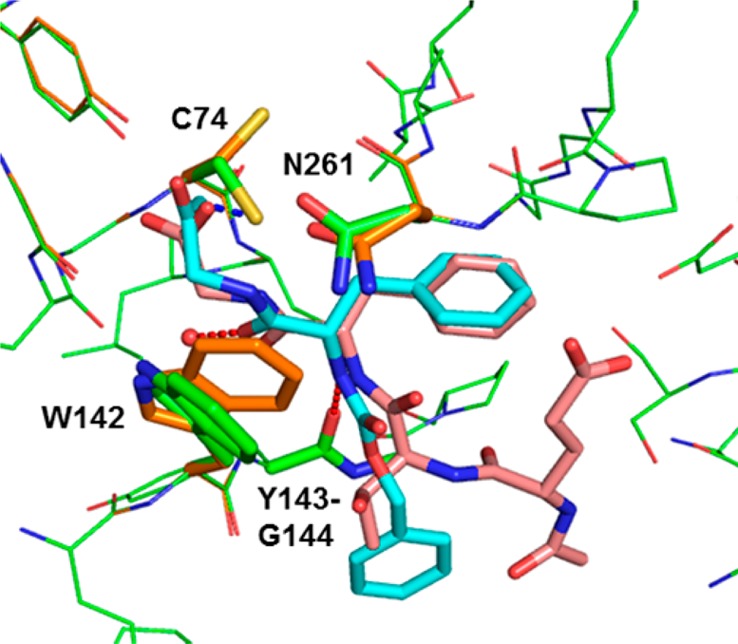
Figure 2.

Overlay of the X-ray crystal structure (PDB code: 2Z0D)12 of the C-terminal LC3 peptide (Glu117-Gly120, salmon) in human ATG4B (orange) with a model of Z-FG-FMK 2 (cyan). Intermolecular hydrogen bonds for 2 are shown as red lines and the covalent interaction with Cys74 is shown in blue. Models were built using the modeling software MOLOC.13 See also Figure S1 in the Supporting Information for a surface representation of the binding site.
