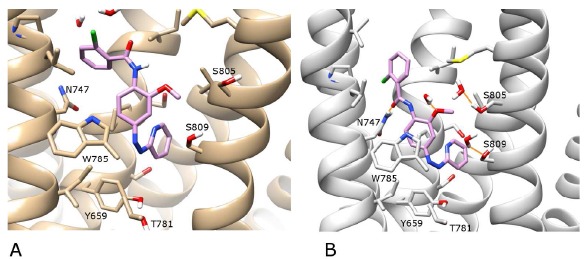
Fig. (9).

A) The photoexcited conformation of alloswitch-1 (in violet) in mGlu5 (in beige) after 200 ns of MD (0-100 ns in “dark”, 100-200 ns photoexcited in “light”). B) The photoexcited conformation of alloswitch-1 (in violet) in an alternative receptor conformation (in grey) after 200 ns of MD (0-100 ns in “dark”, 100-200 ns photoexcited in “light”). H-bonds are shown as orange lines. For visualisation purposes, the backbone of TM6 is not shown, however the sidechains of residues W785 and T781 on TM6 are included (in the foreground). Regarding helix position, TM5 is foreground left, TM7 is foreground right. In the background, TM3 is centre-left and TM2 is centre-right.
