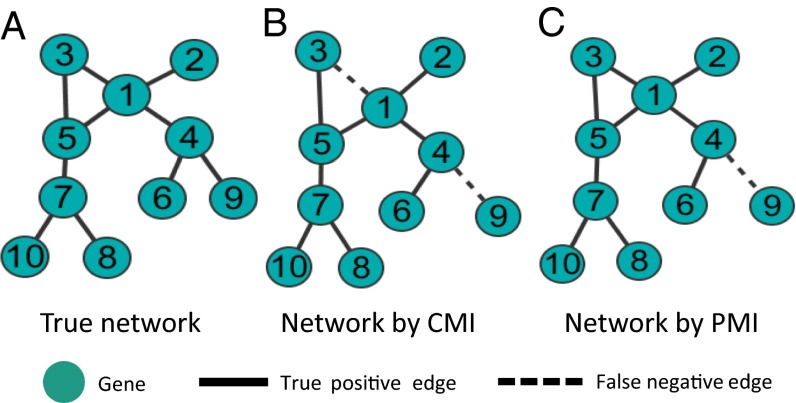
Fig. 3.
Comparison of yeast gene regulatory network reconstructed by PMI- and CMI-based algorithms. (A) The true network of yeast with 10 genes and 10 edges from DREAM3 challenge datasets. (B) The network predicted by CMI with 10 genes and 10 edges, where two false-negative edges are marked by dashed lines. (C) The network predicted by PMI with 10 genes and 9 edges, where one false-negative edge is marked by a dashed line.

