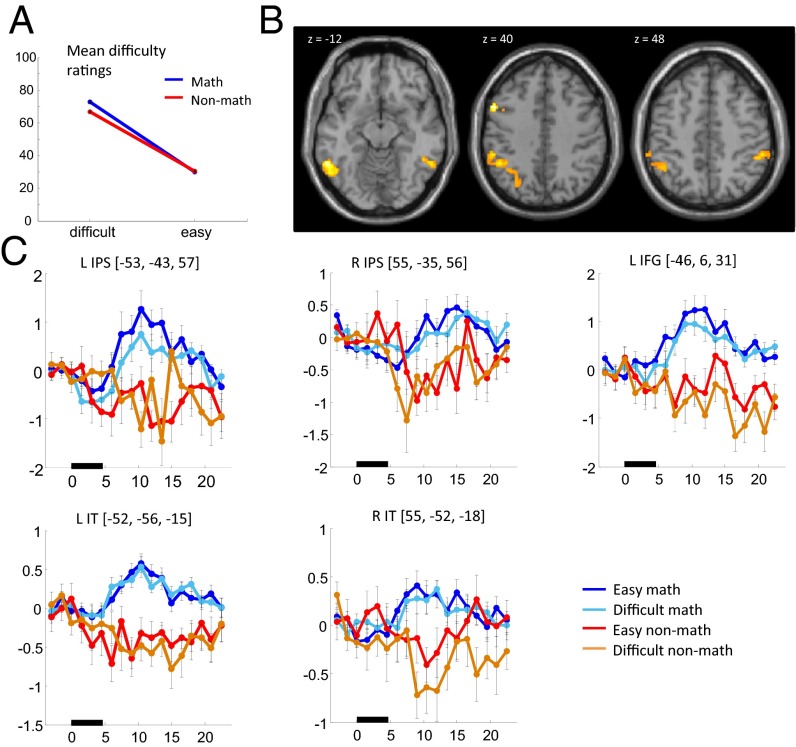
Fig. 5.
Control for task difficulty. For each subject, math and nonmath statements were sorted into two levels of difficulty (easy versus difficult) depending on whether their subjective rating was below or above the subject’s mean. (A) Mean difficulty ratings for easy and difficult math and nonmath statements. The results indicate that activation is organized according to domain (math versus nonmath) rather than difficulty. (B) Axial slices showing the principal regions activated in the contrast “easy math > difficult nonmath” in mathematicians across all meaningful problems (voxel P < 0.001, cluster P < 0.05 corrected). This contrast revealed virtually the same sites as the ones that were activated for the standard math > nonmath contrast. (C) Plots report the temporal profile of activation at the principal peaks identified in the contrast of math > nonmath in mathematicians (same coordinates as SI Appendix, Fig. S1).

