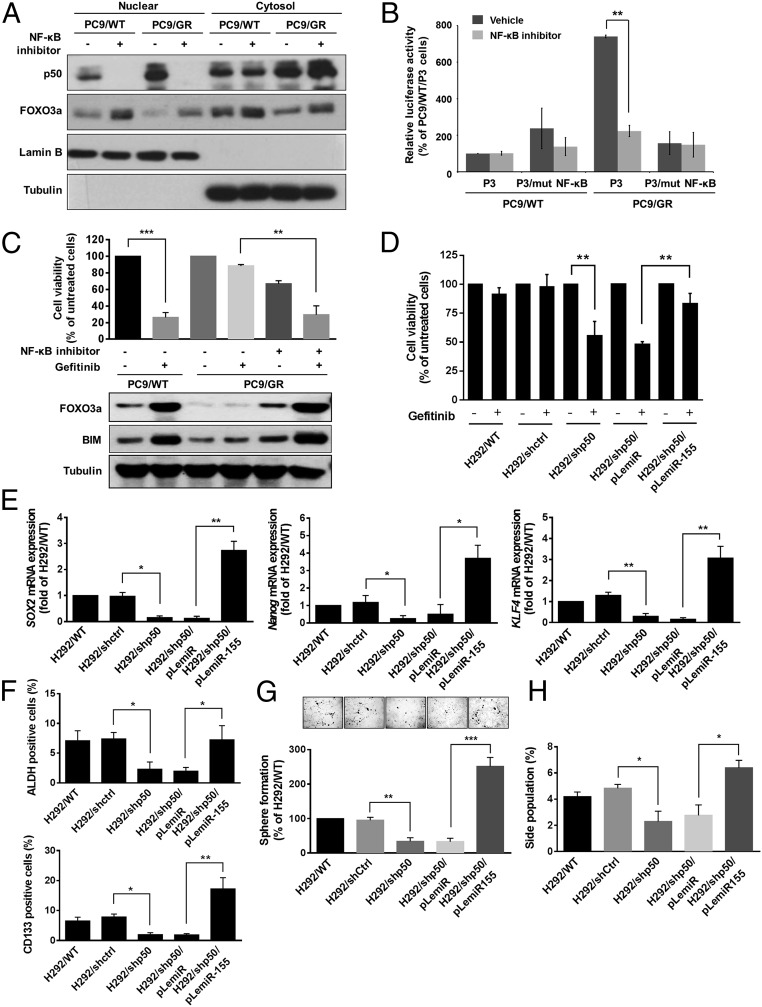
Fig. 6.
Inhibition of NF-κB activity results in reduced miR-155 expression and suppressed gefitinib resistance and CSC properties. (A) Western blot analysis of p50, FOXO3a, Lamin B (nuclear marker), and Tubulin (cytosolic marker) in cytoplasmic and nuclear extracts of PC9/WT and PC9/GR cells treated with or without 2 μM NF-κB inhibitor. (B) Reporter assays of miR-155 promoter containing wild-type or mutant NF-κB binding site in PC9/WT and PC9/GR cells treated with NF-κB inhibitor. (C) Cell viability (Upper) was determined by MTT assay and expression of FOXO3a and BIM (Lower) were analyzed by Western blot in PC9/WT and PC9/GR cells treated with NF-κB inhibitor and 4 μM gefitinib. (D) Cell viability of gefitinib treatment was determined by MTT assay in H292 cells with stable expression of the indicated transfectants. The results are shown as the means ± SD of three independent experiments, each performed in triplicate. **P < 0.01 (two-tailed Student's t test). (E) Expression of miR-155 affected mRNA levels of SOX2, Nanog, and KLF4 by real-time RT-PCR, (F) ALDH+ and CD133+ cells by flow cytometric analysis, (G) sphere formation and (H) side population in H292/WT cells with p50 knockdown and miR-155 overexpression. The graph indicated the differences in the sphere numbers per microscopic field at 100× magnification (G, Upper) and that was calculated the percentage of sphere forming cells compared with PC9/WT cells (Lower). The results are shown as the means ± SD of three independent experiments each performed in triplicate. *P < 0.05, **P < 0.01, and ***P < 0.001 (two-tailed Student’s t test).

