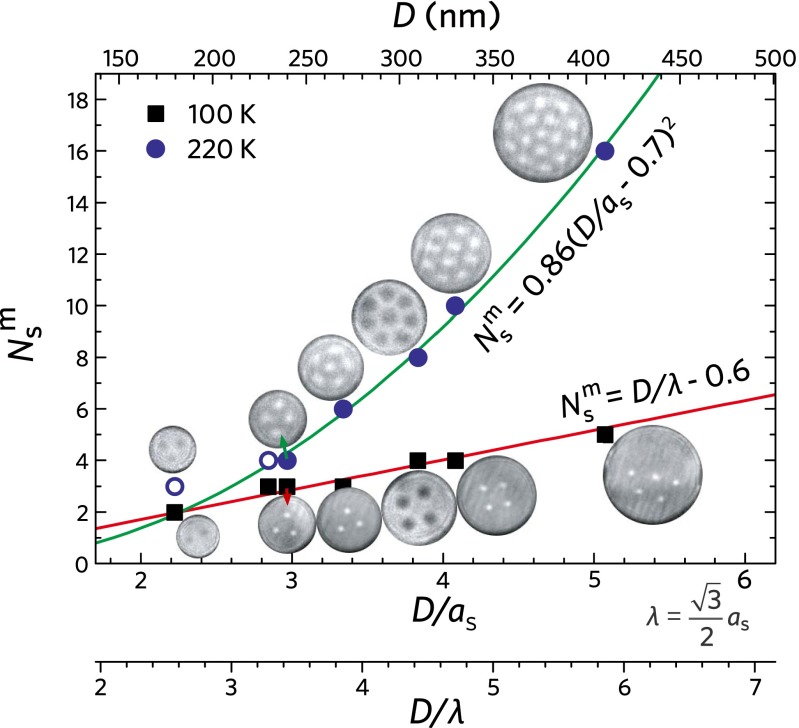
Fig. 4.
The maximal number of skyrmions as a function of disk size at two representative temperatures, 100 K and 220 K. The bright or dark spots represent skyrmions obtained by direct Lorentz TEM imaging. The difference of bright−dark contrast is due to the magnetic chirality inversion of the skyrmions in different crystal chirality. The open blue circles represents the data that are not be used in the fitting parameters at T ≈ 100 K. The curves show square and linear relationships at high temperature and low temperature, respectively, reflecting two different mechanisms to create skyrmions in confined geometry.

