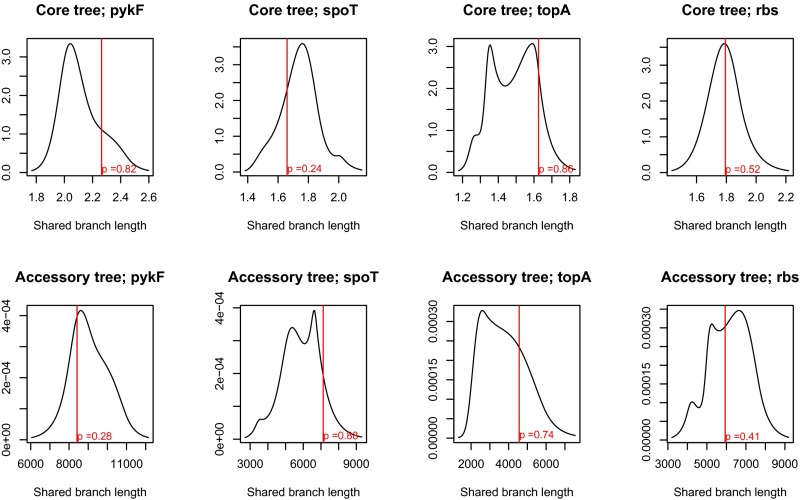
Fig. S2.
Recipient strains are randomly drawn from the larger phylogeny. The strains used as recipients for each gene were tested for being representative draws from core and accessory genome phylogenies. The solid black line indicates the distribution of shared branch lengths of 1,000 draws of the same number of strains as used as recipients for the relevant gene transfer from the comprehensive phylogenies presented in Fig. 1 and Fig. S1. The red line indicates the shared branch length of the actual recipient strains. P values are calculated as the fraction of bootstrapped samples with a lower branch length than the actual sample. Phylogeny (core or accessory)–mutation combinations are indicated in the title of each panel.

