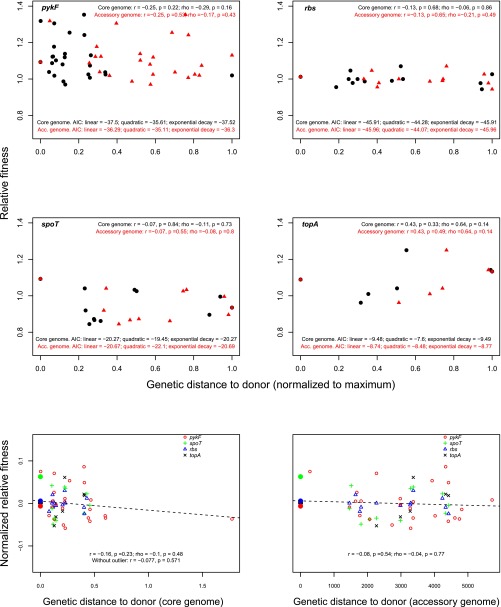
Fig. S4.
Relationship between genetic distance and fitness effects of added mutations. The four Top panels show the relationship between the genetic distance of a recipient strain relative to the strain in which the mutation was selected (the donor strain), based on core (black symbols) and accessory (red symbols) phylogenies, and the fitness effect of the indicated mutation when added to the recipient strain. The Bottom two panels show the relationship between core (Bottom Left) and accessory (Bottom Right) genetic distance of recipient strains relative to the donor strain and the normalized fitness effects of all added mutations. Summary statistics of each relationship are shown in each panel.

