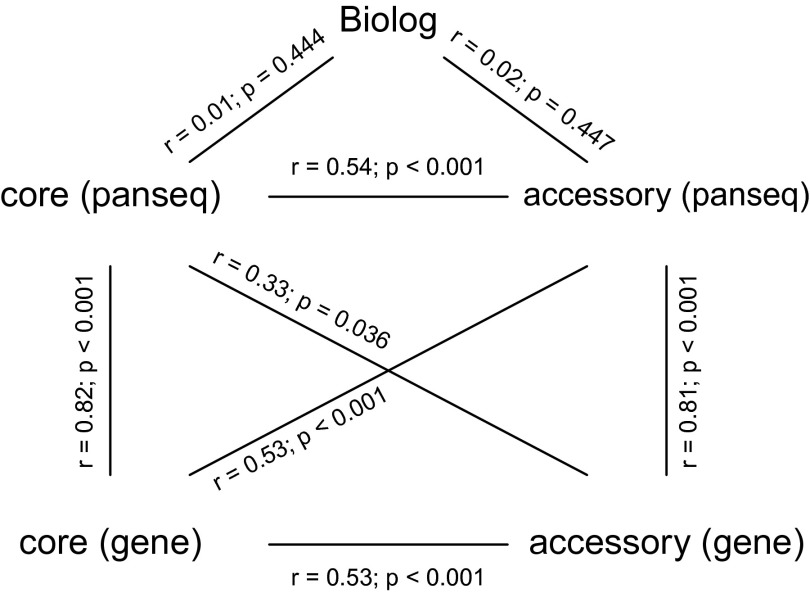
Fig. S7.
Comparison of phylogenies constructed from different approaches (“gene,” whole gene, and “panseq,” DNA windows of size 500 bp) and different datasets (“core” and “accessory” genomes). Approaches and datasets are described in SI Materials and Methods. Mantel tests were used to compare phylogenies. Significant correlations indicate that phylogenies have a higher degree of congruence than expected by chance.

