Fig. S3.
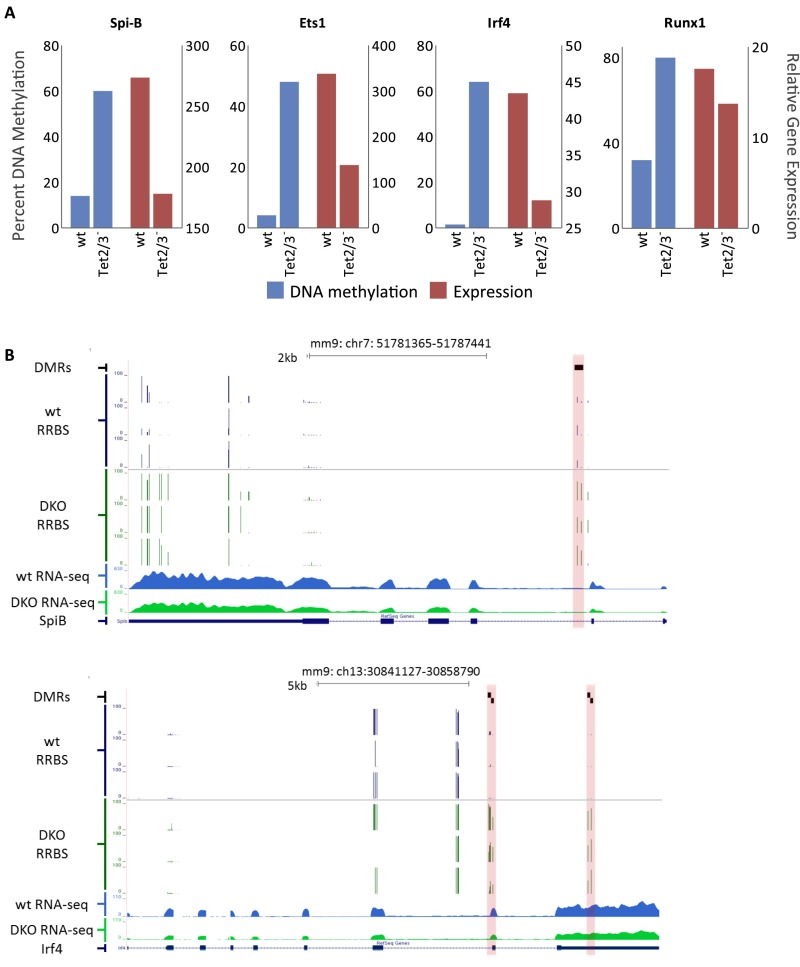
Correlation between DNA methylation and expression. (A) DNA methylation levels (blue) and relative expression levels (red) of selected genes in both wild-type and Tet2/3– FoB cells. (B) RRBS profiles of DNA methylation and RNA-seq analysis at two select loci containing DMRs (highlighted in red) in FoB cells that are associated with genes displaying decreased gene expression in the DKO (average of three replicate experiments).

