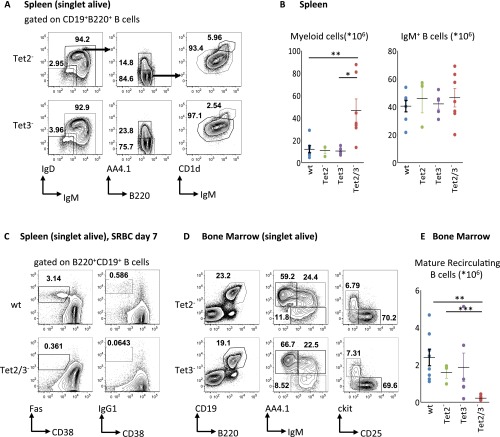
Fig. S6.
Tet2/3 DKO mice display abnormalities during B-cell development. (A) Representative flow cytometry analysis of splenocytes from the indicated genotypes. Numbers adjacent to outlined areas indicate % cells in each plot, and arrows indicate gating strategy Gates depict IgM+ B cells (B220+CD19+IgM+IgD+/−), IgM− B-cell progenitors (B220+CD19+IgM−IgD–), immature IgM+ B cells (B220+CD19+IgM+AA4.1+), mature B cells (B220+CD19+IgM+AA4.1−), follicular (Fo) B cells (B220+CD19+IgM+AA4.1−CD1dlo), and marginal zone (MZ) B cells (B220+CD19+IgM+AA4.1−CD1dhi). (B) Graphs depict total cell numbers of myeloid cells (CD11b+) and IgM+ B cells (B220+CD19+IgM+IgD+) in the spleen (n = 3–7). (C) Representative flow cytometry analysis of splenocytes from SRBC immunized mice of the indicated genotypes. Numbers adjacent to outlined areas indicate % cells in each plot. Gates depict germinal center B cells [B220+CD19+CD95(Fas)+CD38lo] and class switched IgG1+ B cells (B220+CD19+IgG1+CD38lo). (D) Representative flow cytometry analysis of bone marrow cells from the indicated genotypes. Numbers adjacent to outlined areas indicate % cells in each plot, and arrows indicate gating strategy Gates depict total B cells (B220+CD19+), mature recirculating B cells (B220+CD19+IgM+AA4.1–), immature IgM+ B cells (B220+CD19+IgM+AA4.1+), pro-B/pre-B cells (B220+CD19+IgM–AA4.1+), pre-B cells (B220+CD19+IgM–AA4.1+CD25+, ckit–), and pro-B cells (B220+CD19+IgM–AA4.1+CD25–, ckit+). (E) Graph depicts the total cell number of mature recirculating B cells (B220+CD19+IgM+AA4.1–) in the bone marrow (n = 3–7). All plots are gated on live singlets. Graphs depict mean values and SDs of the respective populations. Significance was calculated by the two-tailed Student t test (*P < 0.05; **P < 0.01; ***P < 0.001).

