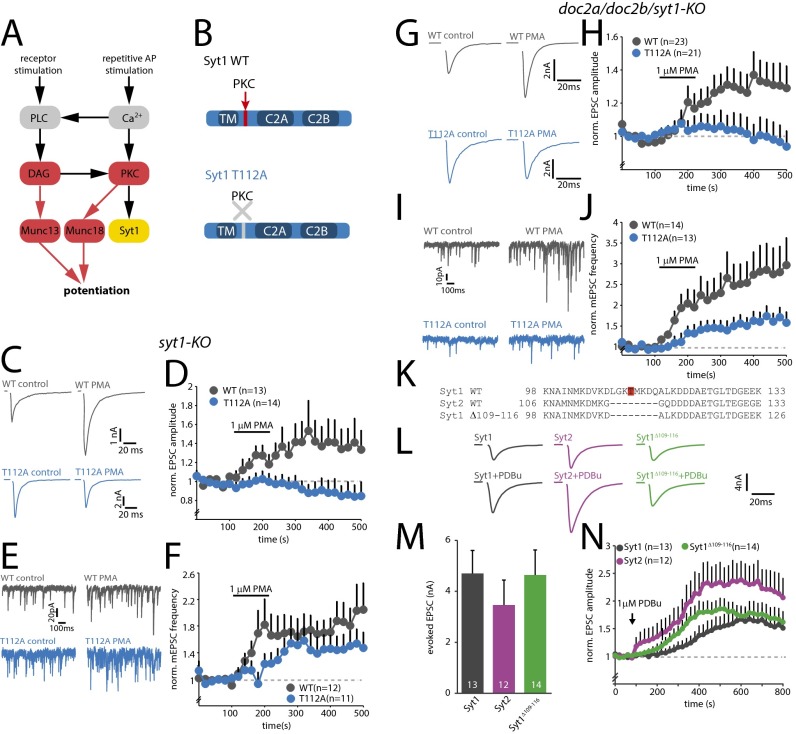
Fig. 1.
Phosphorylation of T112 is essential for phorbol-ester–induced potentiation of vesicle release. (A) Schematic overview of the DAG/PKC pathway. Phospholipase C (PLC) is activated by receptor stimulation or elevated Ca2+ levels, leading to the production of DAG. DAG activates Munc13 and PKC, whereas PKC phosphorylates Munc18 and Syt1. Essential events are indicated in red. The role of Syt1 phosphorylation is the subject of the current study. (B) Schematic representations of SytWT and SytT112A constructs. TM, transmembrane domain. (C) Typical examples of AP-evoked release in control and after superfusion with 1 µM PMA. (D) Change in average normalized evoked EPSC amplitude induced by PMA. APs were evoked at 0.05 Hz (n = 3). (E) Typical examples of miniature EPSCs (mEPSCs) in control and after superfusion with PMA. (F) Change in average normalized mEPSC frequency induced by PMA (n = 3). (G) Typical examples of AP-evoked release in TKO neurons rescued with SytWT and SytT112A in control and after superfusion with 1 μM PMA. (H) Change in average normalized evoked EPSC amplitude induced by PMA in TKO cells. APs were evoked at 0.05 Hz (n = 4). (I) Typical examples of mEPSCs in TKO cells rescued with SytWT or SytT112A in control and after addition of PMA. (J) Changes in average normalized mEPSC frequency induced by PMA in TKO cells (n = 4). (K) Sequence alignment comparing rat Syt1WT, Syt2WT, and Syt1Δ109–116. T112 in Syt1WT is highlighted in red. (L) Typical examples of AP-evoked release in Syt1 KO cells rescued with Syt1WT, Syt2WT, or Syt1Δ109–116. (M) Average AP-evoked EPSC amplitude (n = 6). (N) Change in average normalized evoked EPSC amplitude induced by 1 μM PDBu (n = 6).

