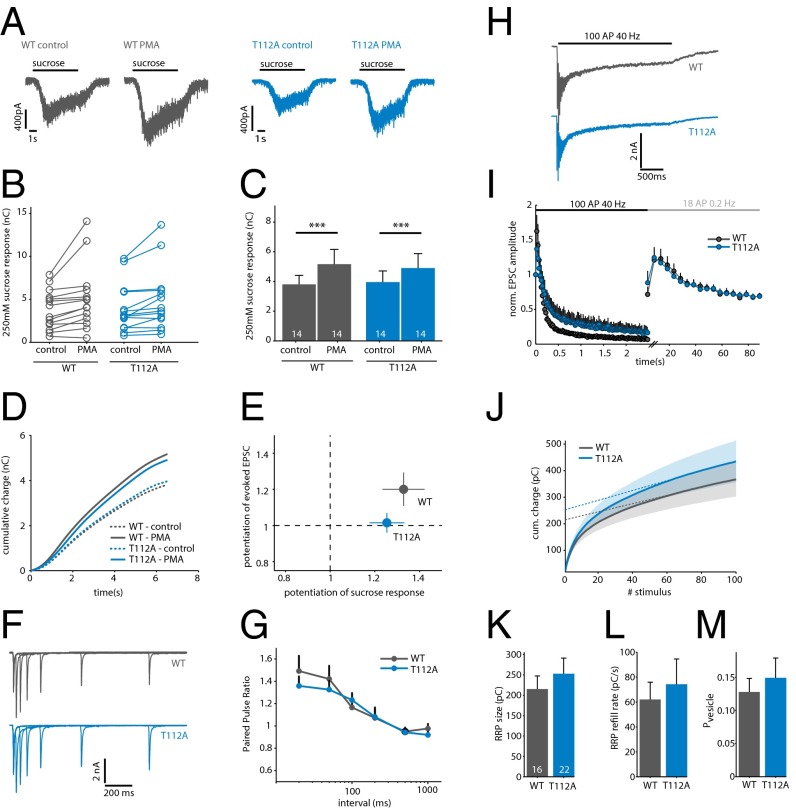
Fig. 3.
SytT112A does not prevent potentiation of sucrose-induced release or STP. (A) Typical examples of responses to 250 mM sucrose in control and after superfusion with PMA. Black bars indicate sucrose application. (B) Effect of PMA on sucrose-induced release in individual cells. (C) Averages of the results in B. ***P < 0.001, Wilcoxon signed-rank test. (D) Average cumulative charge of the sucrose response in control and after superfusion with PMA. (E) Relationship between potentiation in AP-evoked and sucrose-evoked release by PMA in the same set of cells (n = 2). (F) Typical examples of a paired-pulse protocol with 20-, 50-, 100-, 200-, 500-, and 1,000-ms intervals. (G) Average paired-pulse ratio for each interval. Ratio was calculated as EPSC2/EPSC1 (n = 3). (H) Typical examples of EPSCs evoked by 100 AP at 40 Hz. Black bar indicates the AP train. (I) Normalized EPSC amplitude during 100 AP at 40 Hz and subsequent stimulation at 0.2 Hz. Black error bars represent SEM. (J) Cumulative charge of the synchronous EPSC during 100 AP at 40 Hz. Shaded area represents SEM; dotted lines denote a linear fit back extrapolated from the last 40 stimuli. (K) Average RRP size per cell, estimated by back extrapolation of the cumulative synchronous charge in J (n = 3). (L) RRP refilling rate during 40-Hz stimulation, estimated by the slope of back extrapolation. (M) Average vesicular release probability per cell, calculated as charge of first evoked divided by the RRP size.

