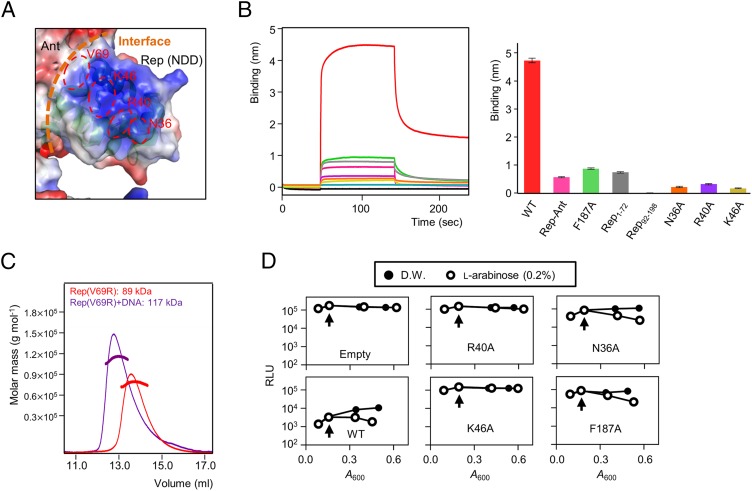
Fig. 6.
Functional analysis of the NDD and DNA-binding model of the Rep tetramer. (A) Electrostatic potential at the molecular surface of the Rep–Ant complex. Three key residues (Asn36, Arg40, and Lys46) are shown in red, and the interface between the NDD and Ant is shown with orange dashed lines. (B, Right) Comparisons of the DNA binding of various Rep proteins by BLI. (Left) Representative BLI sensorgrams of Rep1–198 (red), Rep–Ant complex (pink), Rep1–198 F187A (green), Rep1–72 (gray), Rep92–198 (light blue), and Rep1–198 mutants (N36A in orange, R40A in purple, and K46A in light yellow). Each experiment was repeated three times. (C) The Rep V69R proteins with (purple line) and without (red line) DNA were analyzed by SEC-MALS. The dotted line represents the measured molecular mass. (D) Dual-plasmid bioluminescence reporter assay with WT and mutant Rep. Vertical arrows indicate arabinose induction. Results are representative of three independent experiments. D.W., distilled water; Empty, empty vector (pBAD24); RLU, relative light units.

