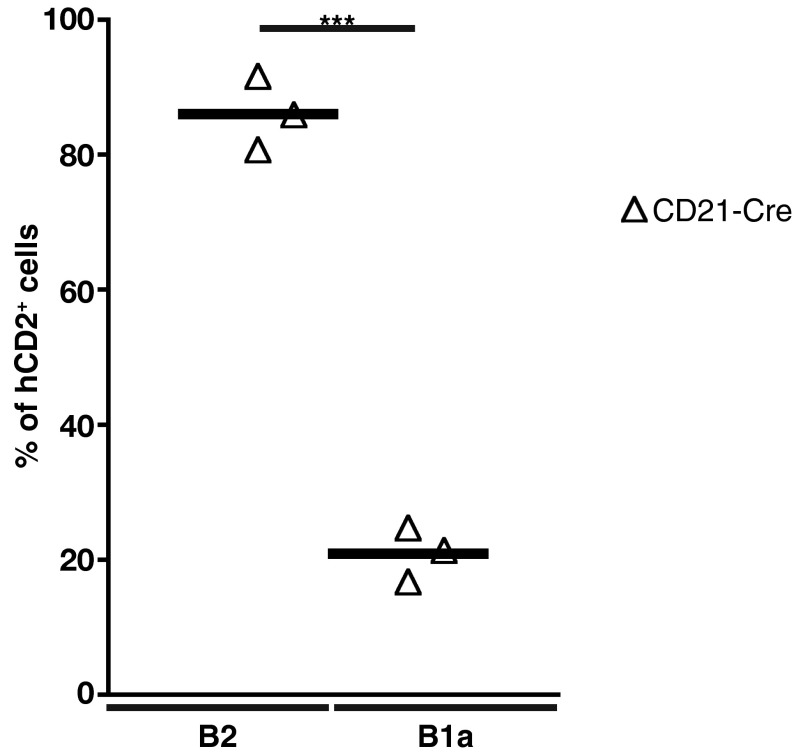
Fig. S5.
Proportions of hCD2+ cells within the B1a and B2 cell subsets. The percentage of hCD2+ B220+CD19+ B2 and B220lo/−CD19+CD5+CD43+ B1a cells in the peritoneal cavity of CD21-cre+ R26-Stopfl-hCD2 mice was determined by flow cytometry. Data are pooled from three experiments (n = 3). Each symbol indicates one mouse, and horizontal lines signify the mean. ***P ≤ 0.001 by Student’s t test.

