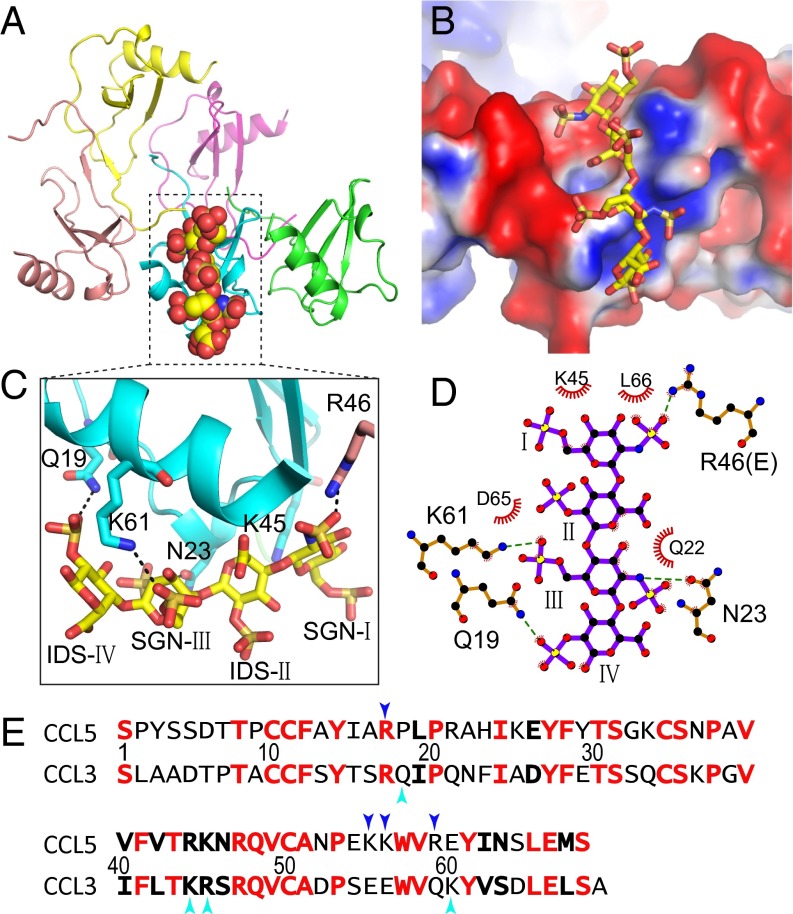
Fig. 4.
Structure of heparin 8f-bound CCL3. (A) Overall structure of 8f-bound CCL3. CCL3 is shown in ribbon representation and colored by chain. Carbon (yellow), oxygen (red), nitrogen (blue), and sulfur (orange) of heparin are depicted in stick. (B) Electrostatic potential is colored from red (−1 kT) to blue (+1 kT). (C) Close-up view and (D) schematic representation of the interaction of CCL3 and heparin 8f. Red “eyelashes” indicate hydrophobic interactions. (E) Sequence alignment of CCL5 and CCL3. Identical and conserved residues are in red and boldface, respectively. Cyan arrows indicate residues involved in the interaction of heparin with CCL3 and blue arrows indicate those with CCL5.

