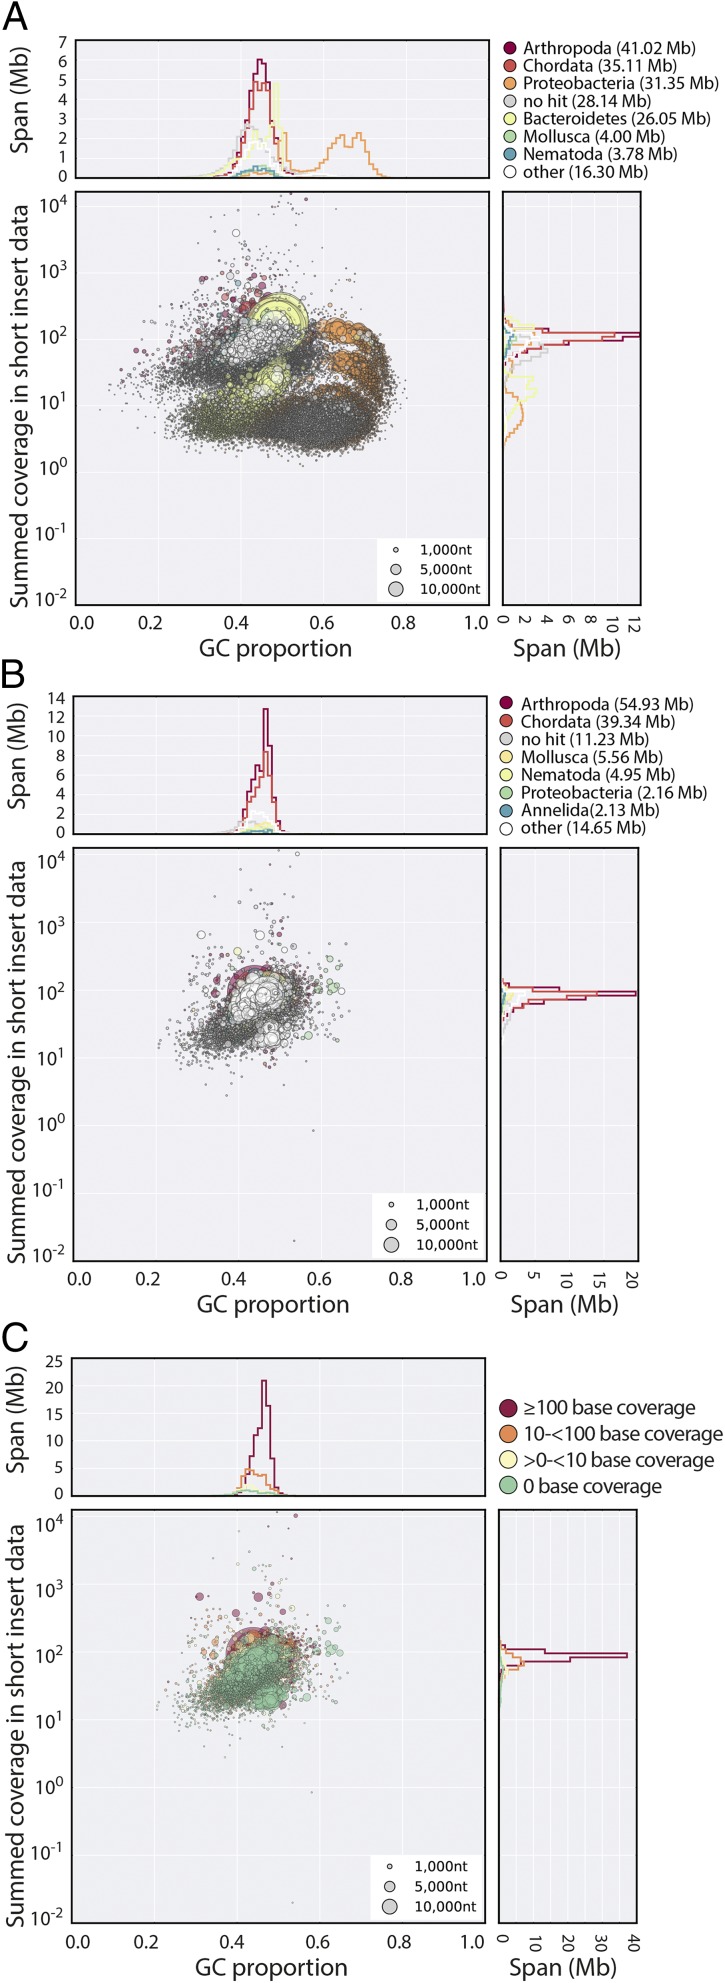
Fig. 1.
H. dujardini genome assembly. (A) Blobplot of the initial nHd.1.0 assembly, identifying significant contamination with a variety of bacterial genomes. Each scaffold is plotted based on its GC content (x axis) and coverage (y axis), with a diameter proportional to its length and colored by its assignment to phylum. The histograms above and to the right of the main plot sum contig spans for GC proportion bins and coverage bins, respectively. (B) Blobplot of the nHd.2.3 assembly (as in A). (C) Blobplot of the nHd.2.3 assembly, with scaffold points plotted as in B but colored by average base coverage from mapping of RNA-Seq data (42). A high-resolution version of this figure is available in SI Appendix.

