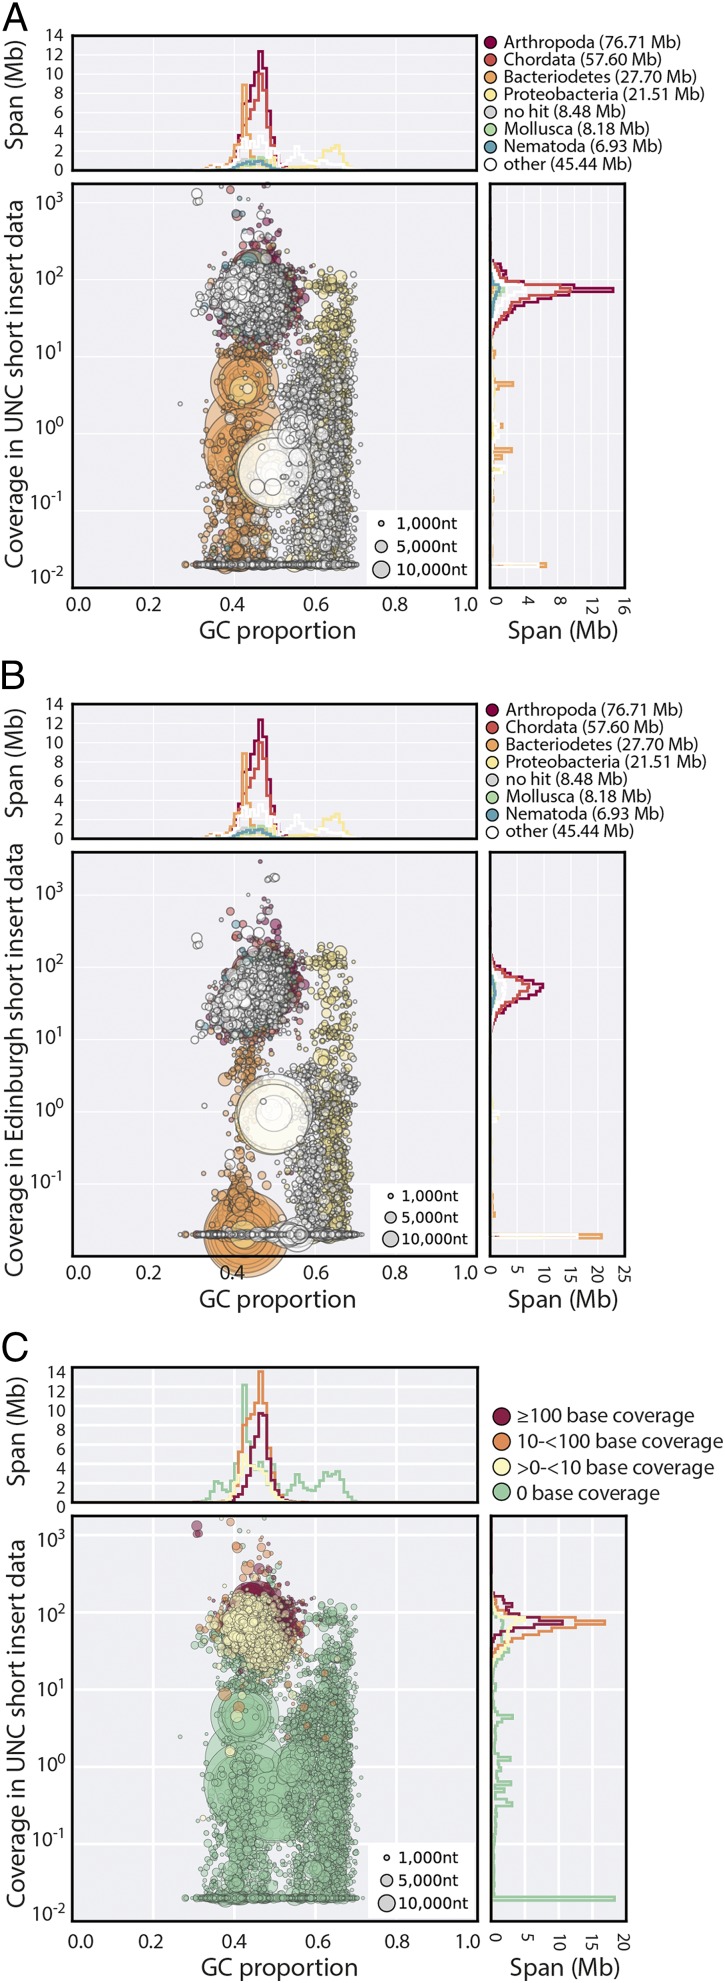
Fig. 2.
Contaminants in the UNC assembly. (A) Blobplot of the UNC assembly with coverage derived from pooled UNC raw genomic data. (B) Blobplot showing the UNC assembly with coverage derived from the Edinburgh short insert genomic data. (C) Blobplot (as in A) with the scaffold points colored by average RNA-Seq base coverage. A high-resolution version of this figure is available in SI Appendix.

