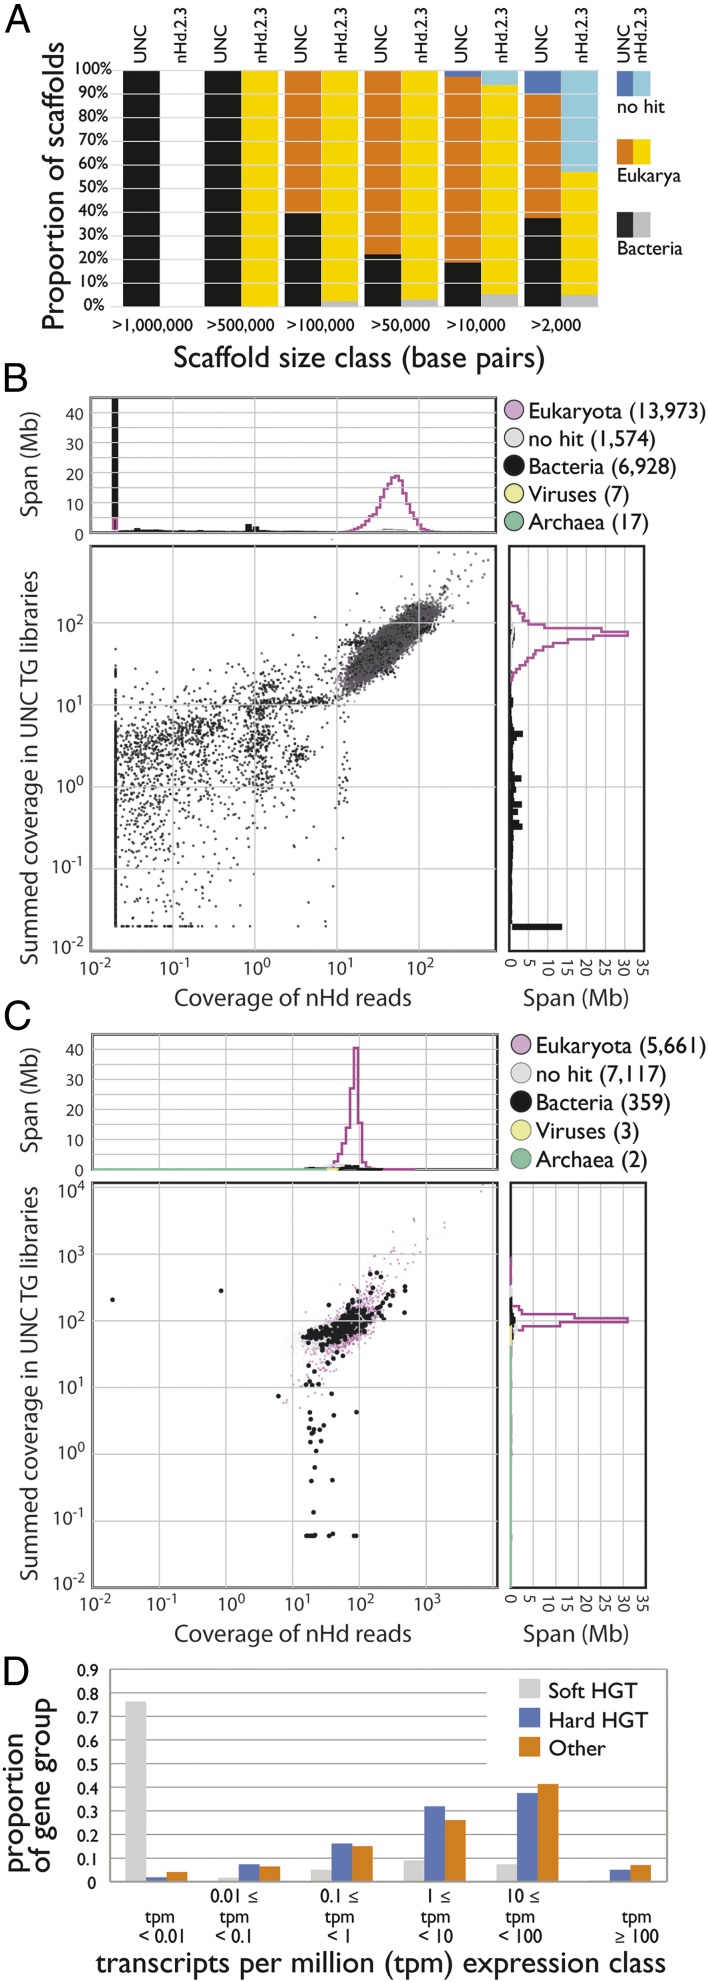
Fig. 3.
Identifying HGT candidates. (A) Stacked histogram showing scaffolds assigned to different kingdoms (Bacteria, Eukaryota, and “no hits”) in different length classes for UNC and nHd.2.3 assemblies. The nHd.2.3 assembly had no scaffolds >1 Mb, and all of the longest scaffolds (>0.5 Mb) in the UNC assembly were bacterial. (B) Coverage-coverage plot of the UNC assembly using the Edinburgh short insert data (x axis) and in the pooled UNC short insert data (y axis). (C) Coverage-coverage plot of the nHd.2.3 assembly as in B. (D) Expression of soft and hard HGT candidates, and all other genes, in the nHd.2.3 assembly. A high-resolution version of this figure is available in SI Appendix.

