Figure 1.
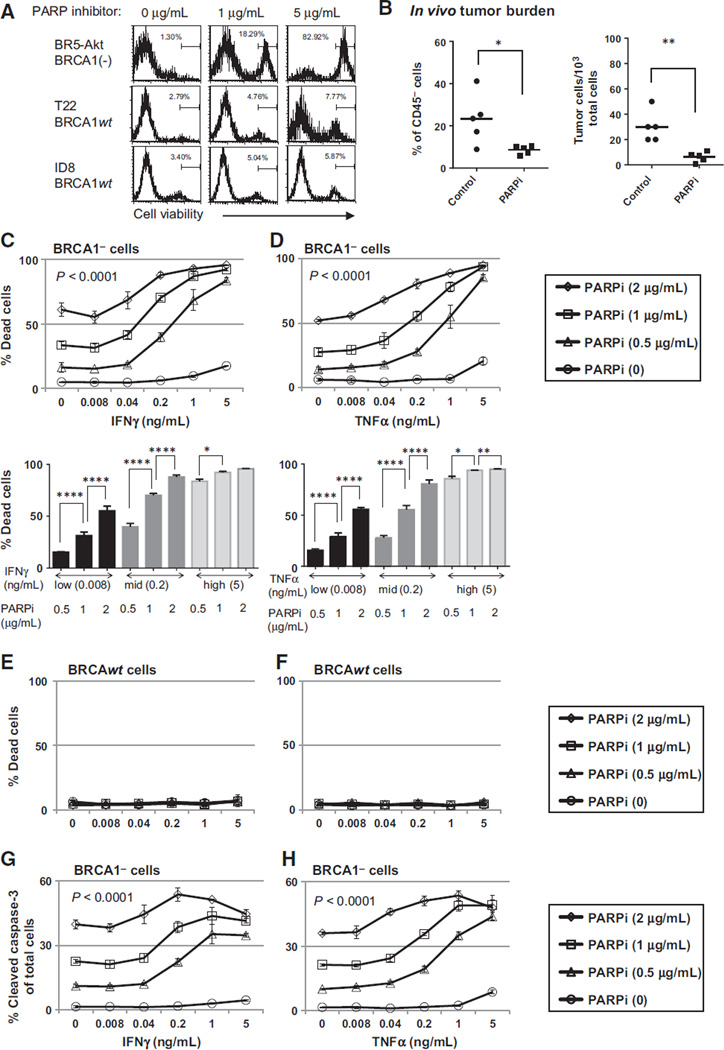
Th1-type cytokines enhance the cytotoxic effect of PARP inhibition in BRCA1 ovarian cancer cells. A, BRCA1 (BR5-Akt) and BRCAwt (T22, ID8) cell lines were cultured in 24-well plates at a starting concentration of 1 104 cells per well with or without the PARP inhibitor (PARPi) at the indicated dose, and analyzed at 72 hours for cell viability by flow cytometry. B, peritoneal cells were harvested by PBS wash on day 7 from BRCA1 tumor–bearing mice treated with the PARPi (40 mg/kg/day; days 3–6) and analyzed by flow cytometry for the percentage of CD45 tumor cells (left). In addition, total ascites cells were plated at serial dilutions for 72 hours, and the number of tumor colonies among total ascites cells was counted as an estimate of viable tumor burden (right). (Left, P 1/4 0.0271; right, P 1/4 0.0032, Student t test.) C and D, BRCA1 cells were cultured in 24-well plates for 72 hours in the presence of 0, 0.5, 1, or 2 µg/mL of PARPi and either IFNγ (C, top, PARPi dose effect, P < 0.0001; IFNγ dose effect, P < 0.0001; interaction, P < 0.0001) or TNFα (D, top, PARPi dose effect, P < 0.0001; TNFα dose effect, P < 0.0001, interaction, P < 0.0001) at the concentrations indicated. Cells were then stained with a fixable cell viability dye and analyzed by flow cytometry for the percentage of dead cells. Top dose-response curves show the interaction dose effect between cytokine concentration and PARP inhibitor treatment. Bottom bar graphs illustrate the dose effect independent of interaction. E and F, BRCAwt (T22) cells were assayed for viability as in C and D and show no treatment effect with increasing concentrations of cytokines or the PARP inhibitor. G and H, the fixable viability dye allowed for analysis of intracellular staining for active caspase-3. BRCA cells treated with PARPi and IFNγ (G) or TNFα (H) were intracellularly stained and cells positive for active caspase-3 are presented as a percentage of total cells (PARPi dose effect, P < 0.0001; IFNγ dose effect, P < 0.0001; interaction, P < 0.0001). Assays were repeated a minimum of three times. 0, P < 0.05; 00, P < 0.025; 000, P < 0.005; 0000, P < 0.0001 by ANOVA and Tukey procedure for multiple comparisons.

