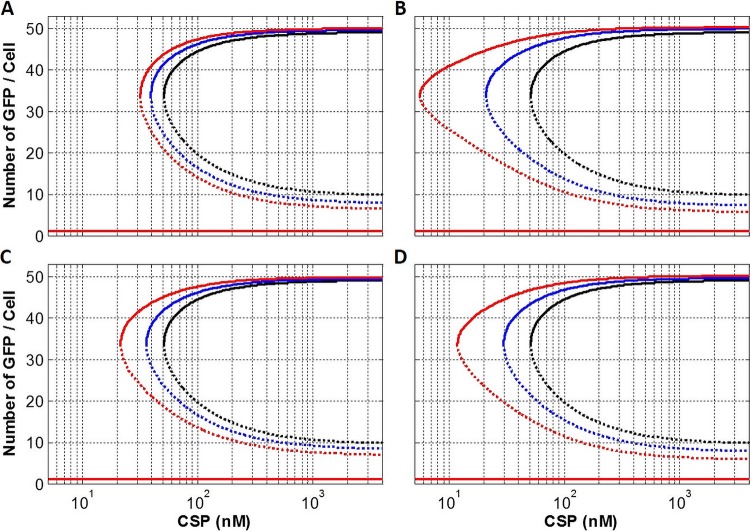
FIG 10.
Effect of different carbohydrate sources on a deterministic simulation for the ComR/S circuit. Each panel shows the hysteresis (the “S” shaped curve) from the ComR/S auto-feedback circuit. Each curve is composed of two solid lines (two stable states, bimodal) and one dotted line (unstable state, a threshold to activate the bimodal circuit). To evaluate the most probable mechanism, we simulated the proposed mechanisms for which the degradation rate of ComR (A), the degradation rate of XIP (or ComS) (B), the dissociation constant for ComR/XIP (or ComR/S) complex inducing PcomS (C), or the dissociation constant for ComR/XIP (or ComR/S) complex formation (D) is decreased by 0% (glucose [black line]), 20% (fructose [blue line]), and 40% (trehalose [red line]). See the text for more details.

