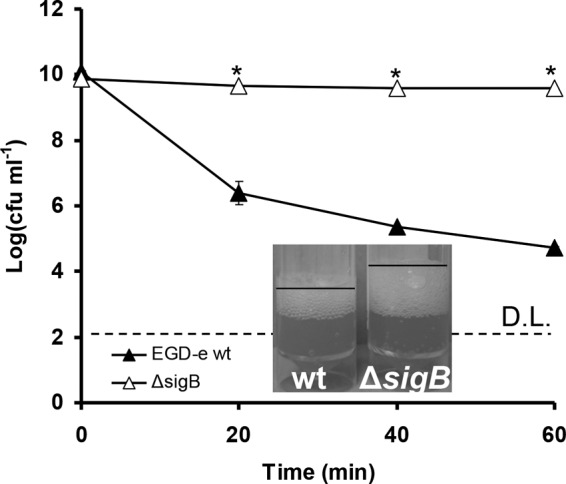
FIG 2.

Cells of EGD-e WT (black triangles) and its isogenic ΔsigB mutant (white triangles) grown aerobically until stationary phase and challenged with 4.5% H2O2 at 30°C. D.L. denotes the detection limit, and the asterisks denote a difference with statistical significance (P < 0.05). Catalase tests were performed in triplicate (one representative experiment is shown) with the addition of 100 μl of 30% H2O2 solution in a 5-ml sample of the cultures. Cultures for catalase tests were grown under conditions similar to those used in challenge tests. The error bars represent the standard deviations.
