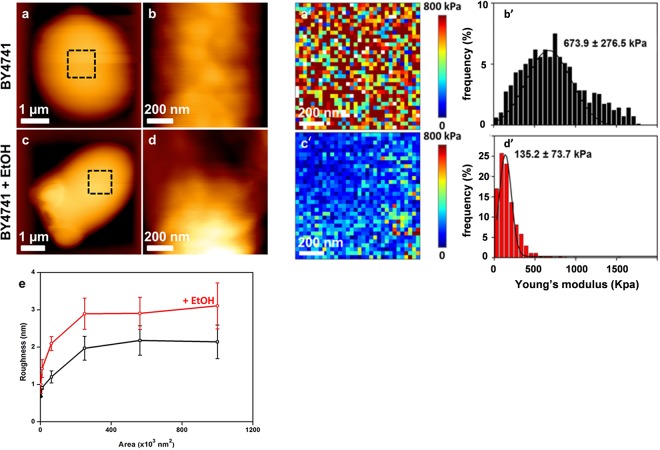
FIG 1.
AFM imaging of wild-type cells treated with ethanol. High-resolution AFM images (z range = 100 nm) of exponentially growing BY4741 cells on YPD that were not treated (a and b) or were treated for 5 h with 9% ethanol (EtOH) (c and d). (e) Levels of roughness measured at different areas on the cell surface for untreated (black line) and ethanol-treated (red line) BY4741 cells. Elasticity maps (z range = 800 kPa) were recorded for an untreated cell (a′) and a cell treated with 9% ethanol (c′). Young's modulus values (from 1,024 force curves) corresponding to the elasticity maps are shown for an untreated cell (b′) and an ethanol-treated cell (d′).

