FIG 5.
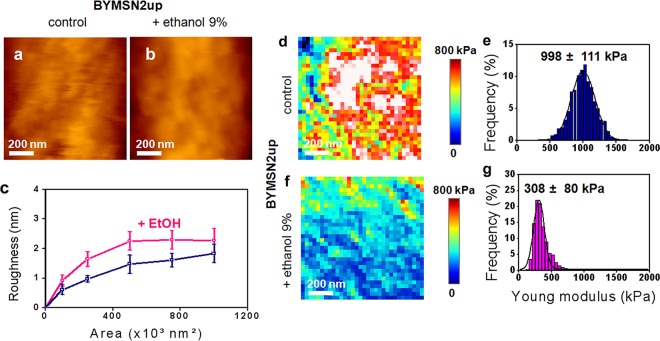
AFM imaging and elasticity mapping of the BYMSN2up mutant before and after ethanol treatment. The same procedure as that described in the legend to Fig. 1 was used, except that high-resolution AFM images (z range = 100 nm) were obtained for untreated (a) and ethanol-treated (b) mutant cells that expressed MSN2 under the control of the strong PGK1 promoter. (c) Levels of roughness. The elasticity maps (z range = 800 kPa) (d and f) and distributions of Young's modulus values (e and g) were obtained from 1,024 force versus indentation curves for control and 5-h ethanol-treated mutant cells.

