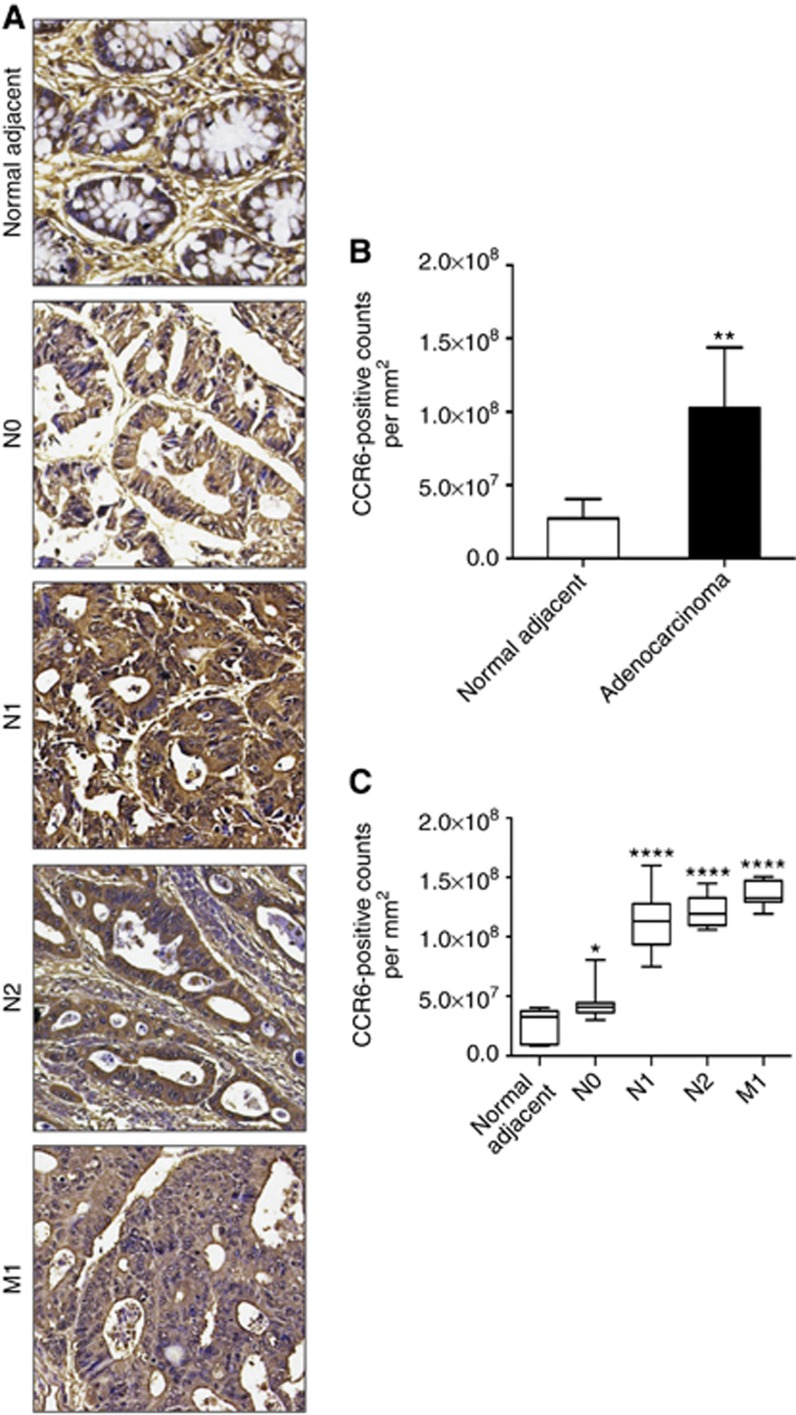
Figure 1.
CCR6 expression in colon cancer tissue. (A) Immuno-intensity of CCR6 (brown) in normal adjacent tissue and AC tissue with no nodal involvement (N0), nodal involvement (N1 and N2) and distant metastasis (M1). Digital images were acquired using 20 × -objective of TissueFAXS and CCR6 expression was quantified using HistoFAXS analysis software. (B) CCR6 expression in adjacent normal tissue and AC tissues is represented as DAB-positive counts per mm2 area. **P-value<0.01 between normal adjacent and AC. (C) Cases were further stratified according to nodal involvement (N0, N1 and N2) and distant metastasis (M1), and CCR6 expression in each subtype is presented as box plot, showing the minimum and maximum values. Median value of CCR6 expression is represented by the line in the box plots. *P-value<0.05 between adjacent normal vs N0 and ****P-value<0.0001 between adjacent normal vs N1/N2/M1 cases. Significant increase (****P-value<0.0001) was observed when non-metastatic cases (N0) were compared with cases with regional and distant metastasis. Mann–Whitney's U-test was used to determine statistical significance between each group.

