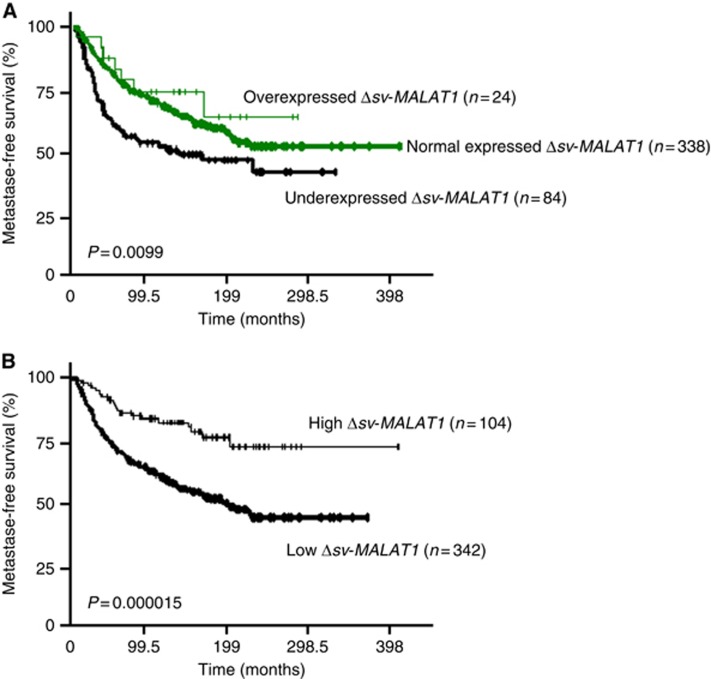
Figure 3.
MFS curves of patient groups according to Δsv-MALAT1 mRNA expression level in the series of 446 breast tumours.(A) MFS curves of three patients groups with under, normal and overexpressed Δsv-MALAT1 tumours, as compared with normal breast tissues. (B) MFS curves for patients with high-Δsv-MALAT1-expressing and low-MALAT1-expressing tumours, using an optimal cut-off value.

