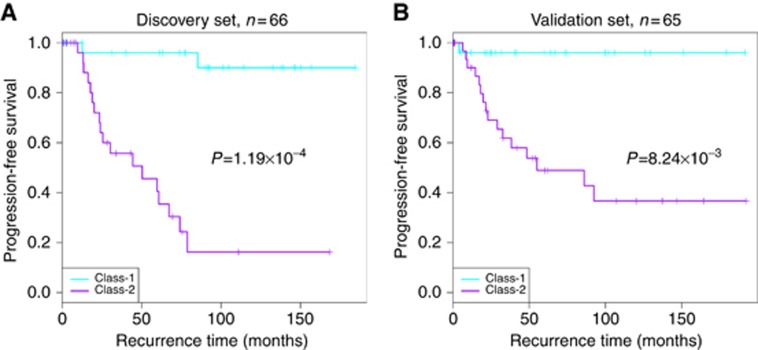
Figure 1.
Rare histological EOC cases with PFS information in Mayo Clinic dataset. (A) For the samples in Mayo Clinic internal discovery set (n=66), Kaplan-Meier plot of progression-free survival demonstrates a clear outcome difference between Class-1 and Class-2, with better outcome in Class-2 group. (B) For the samples in Mayo Clinic internal validation set (n=65), Kaplan–Meier plot of progression-free survival confirms the outcome difference between Class-1 and Class-2. Cyan and purple colours indicate recurrence curves of Class-1 and Class-2 cases, respectively.

